- Research
- Open access
- Published:
Effects of land use change on soil physicochemical properties in selected areas in the North West region of Cameroon
Environmental Systems Research volume 7, Article number: 3 (2018)
Abstract
Background
Land use changes from natural ecosystems into managed ecosystems may have deleterious effects on soil structure and quality. This study characterise the soils under, and assesses the effects of different land use systems on selected soil physicochemical properties in the North West region of Cameroon. Six land use systems including: natural forest, natural savanna, grazing land, afforested land, farmland and Eucalyptus plantation were identified. Ninety soil samples were collected from each at the 0–15 cm depth. Fifteen soil physicochemical properties were measured.
Results
The conversion of natural forest or savanna to farmland reduces the silt contents, moisture content, organic matter, organic carbon, total nitrogen, available phosphorus, pH, cation exchange capacity and exchangeable bases, but increases bulk density, electrical conductivity, exchangeable acidity and sand content significantly (P < 0.05). The results revealed that deforestation and subsequent cultivation of soil had negative effects on the measured soil properties.
Conclusions
Land use change has ruined soil quality in the North West region. To reverse soil degradation and promote restoration, emphases should be placed on promoting the use of sustainable land management practices within the savanna, grazing, agricultural and forest management systems.
Background
Land use/land cover (LULC) changes influence the biogeochemistry, hydrology, and climate of the earth. Elucidating the impact of LULC at the local to regional scales on soil quality status is not direct but rather complex to guarantee any generalizations (Hoogsteen et al. 2015). Across sub-Saharan Africa, natural resources remain central to rural people’s livelihoods (Roe et al. 2009). Nonetheless, natural (rainfall and temperature) as well as anthropogenic (farming, grazing, burning) forces can exert pressure on these resources, thereby influencing spatial and temporal scale changes on a landscape. LULC changes are indicators of forest resource dynamics within a landscape. The dynamics of LULC change associated with the anthropogenic activities are occurring rapidly in tropical landscapes. Recent international concerns place high attention on monitoring changes in tropical resources and reporting on those factors (such as agriculture) influencing these changes (such as deforestation), for consideration of novel scientific and policy interventions (goal #15 of the 2030 Agenda for Sustainable Development). To understand the dynamics of ecological processes and the impacts related to these changes in LULC, an assessment of the effects of these changes on soil quality is important.
According to the United Nations Convention to Combat Desertification (UNCCD), 24 billion tons of fertile soils are lost due to erosion every year, while 12 million hectares of land are degraded through drought and the encroachment of the desert (this is 23 hectares per minute) where 20 million tons of grain could have been grown. Epule et al. (2011) stated that Cameroon’s forests are part of the Congo Basin and it is ranked the second largest tropical rainforest hot spot in the world after the Amazon Basin in Latin America largest. FAO (2010a) remarked that Cameroon’s forest contains about 2696 million metric tons of carbon in living biomass. This indicates that deforestation is even more intimidating for the environment. Even so, FAO (2010a, b) reported that Cameroon forests occupies about 28 million hectares (ha) of land and of this number, about 220 thousand (ha) are lost each year; this is equivalent to about − 1.0% of annual forest cover loss. Evidence, though anecdotal, reveals that the population growth in Cameroon and scarcity of arable land has exacerbated food insecurity and water scarcity. FAO (2009) forecasted that the high population density with continued demand for arable land in Africa would amplify deforestation pressure. In fact, land degradation is a very serious challenge as it leads to hunger, poverty and is at the root of many conflicts (FAO 2017). Progress towards meeting the sustainable development goal # 15 of the 2030 agenda requires an understanding of the drivers of soil degradation.
It is reported that an ample surface area of African forests has been lost, with a significant influence resulting from small scale agriculture (FAO 2009; Harvey et al. 2004). In fact, Cheek et al. (2000) and Harvey et al. (2004) projected a 96.5% future loss of the original forest cover within the Bamenda Highlands, with its climate change implications. The need for sustainable land use-ecosystems conjures the protection and enhancement of soil quality through designing efficient site specific actions to control erosion and restore soil quality, thereby improving the conditions and productivity of the agro-silvipastoral landscapes in the western highlands region of Cameroon. The objectives of this study include: (i) to characterize the soils under the different land use systems; and (ii) to assess the influence of land use change on selected soil physicochemical properties in the North West region of Cameroon.
Methodology
Description of the study area
This study was conducted in the North West Region of Cameroon which lies between latitudes 5°45″ and 9°9″ N and longitudes 9°13″ and 11°13″ E. It covers an area of about 17,400 km2 and is bordered to the North and West by the Republic of Nigeria, to the South by the West and South West Regions and to the East by the Adamawa Region (Manu et al. 2014). The topography of the Region varies greatly from depressions lower than 400 m above sea level to high mountains, 3000 m above sea level. Three study sites were selected following a stratified random sampling technique. Each stratum represents a particular topographic zone [the lower altitude (< 900 m); the mid-altitude (900–1500 m) and the high altitude (> 1500 m)] within the North West Region. The representative study sites selected include Ndop (lower altitude), Nkwen (mid-altitude) and Awing (high altitude) (Fig. 1).

Topographic map showing the locations where soil samples were collected within the North West Region of Cameroon
The topography greatly influences the climate with a tropical transition from the rainy humid and continuously warm climate in the South to an extremely unpredictable (regarding temperature and precipitation) but somewhat dry and hot climate of the North. Absolute annual average precipitation ranges from 1700 to 2824 mm. The high altitudinal areas are cold (< 15 °C) such as Awing and Santa whereas the low altitude zones are hot (average 27 °C) such as Ndop plain and Ako Sub Division. There are two distinct seasons: the rainy season (mid-March to mid-October) and the dry season (mid-October to mid-March). The vegetation here results from the prevailing soil conditions, altitude, human activities on the environment and climate. The region lies within the savannah zone where grasses and shrubs predominates. The dominant soil type is Oxisol (rich in oxides of Fe and Al and has a characteristic reddish color) which encourages erosion (pseudo sand and pseudo silt) and results to gullies on bare surfaces while the valleys are covered with alluvial deposits (Yerima and Van Ranst 2005a, b; Yerima 2011).
Land use/land cover systems identified in the North West Region
Six LULC systems were identified and presented as follows:
-
i.
Farmland: It is characterized by the cultivation of crops such as cabbages, onion, carrot, pumpkins, and green pepper. Annual crops such as maize, potatoes, beans, and pea, are most commonly cultivated (Fig. 2). Subsistence farming characterizes agriculture in the study area, and the main cropping system is mixed, although rotation, inter-cropping, mono-cropping and fallow systems are also common.
Fig. 2 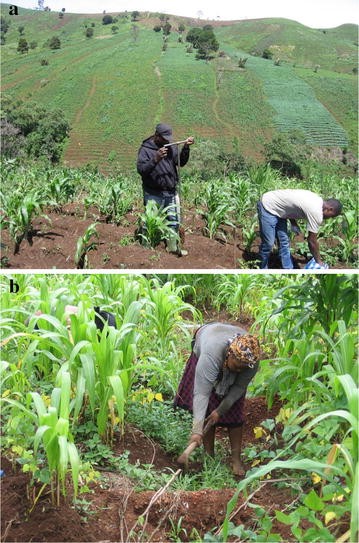
Collection of soil samples from farmlands on varying geomorphic surfaces (a); a common tillage practice on farmlands in the North West Region (b)
-
ii.
Natural forest land: It is composed of various indigenous trees, shrubs, and bushes like Podocarpus falcatus (Zigba) (Fig. 3). The forest is usually found in protected areas where it is restricted from farming or livestock grazing. However, the culture has not allowed replanting (reforestation) and the newly germinating seedlings are being destroyed by farm encroachment and animals browsing and trampling. Due to high deforestation rates, these forests are found in patches, often located in valleys and small depressions which often harbor streams and other water bodies.
Fig. 3 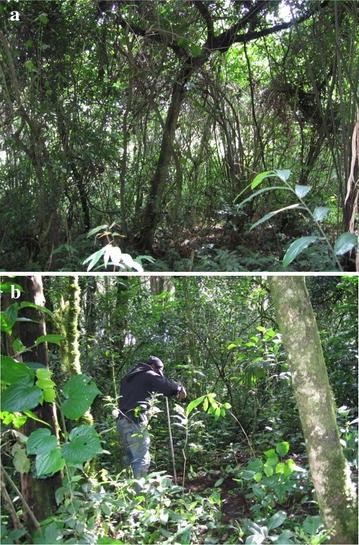
Protected man-made forest at the Yongka Western Highlands Research Garden Park (a); the collection of soil samples from a naturally protected forest adjacent to Lake Awing (b)
-
iii.
Natural savanna: It is composed of short grasses and usually located within protected areas (Fig. 4). This land use system is used for grazing in areas where no property right exists. It is believed to have been created due to the shrinkage of the forest cover as a result of deforestation due to human and animal disturbance.
Fig. 4 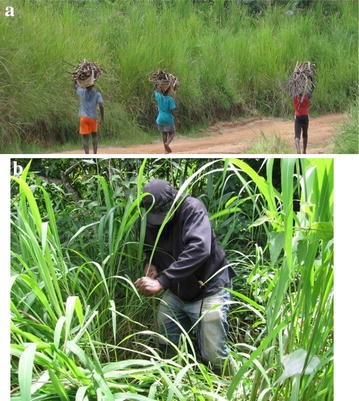
Natural savanna grassland located near a palm plantation at Nkwen, Bamenda (a); the collection of soil samples from natural savanna land at the Yongka Park (b)
-
iv.
Eucalyptus plantation: It predominantly consists of two commonly known exotic eucalyptus species in the region (Eucalyptus salinga and Eucalyptus grandis). These tree stands are indiscriminately planted on water catchments and are gradually replacing native tree species of the NW region (Fig. 5).
Fig. 5 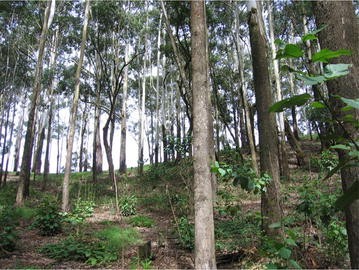
Eucalyptus salinga plantation at Awing
-
v.
Afforestation area: It is represented by an afforested research unit created in 2010 (6–7 years ago), characterized by fast-growing environmentally friendly tree species for fuel and timber (Fig. 6) to reduce pressure on the endangered native tree species which are at risk of extinction. Some of these plant species include: pine, Zigba (Podocarpus falcatus), large diameter rattans (Laccosperma secundiflorum and L. robustum species), mahogany (Swietenia macrophylla King), iroko (Milicia excelsa), Pygeum (Prunus Africana), mango (Mangifera indica) and other plant species that have food, fuelwood, medicinal, timber, etc., attributes (Yerima 2011).
Fig. 6 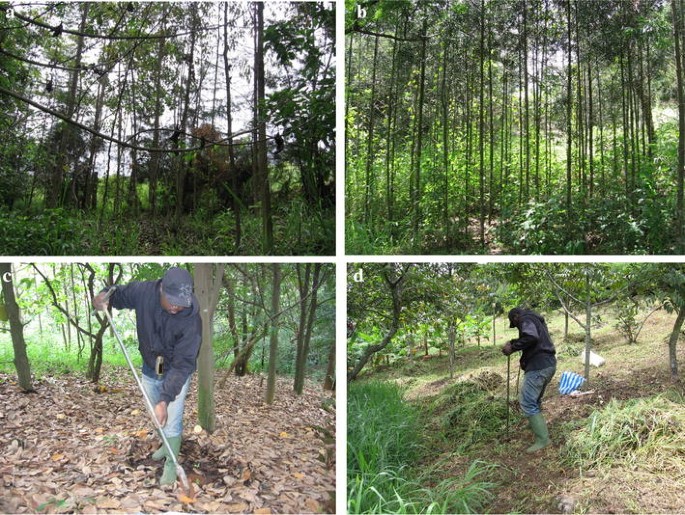
Nine year old Eucalyptus saligna tree stand (a); 8 years old Podocarpus (Podocarpus falcatus) tree stand (b); collection of soil samples under a Jackfruit tree stand (c); collection of soil samples under a mixed fruit tree stand (Prunus domestica, Mangifera indica) at the Yongka Highland Research Garden Park (d)
-
vi.
Grazing land: It consists of short grasses (pasture) and used for cattle grazing and is considered a communal land (Fig. 7). Under such interference, it has become very difficult to find natural settings in the area (Yerima 2011).
Fig. 7 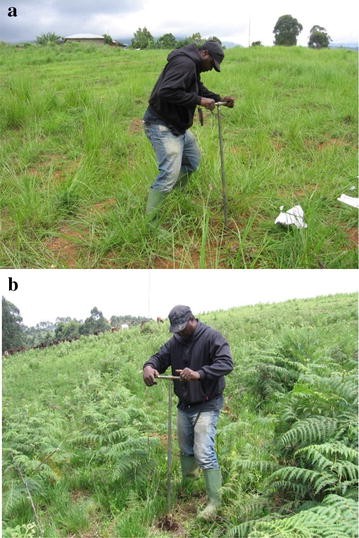
Collection of soil samples from grazing land at Ntambang (a) and Santa (b)


Soil sampling and analysis
The soils were characterized following procedures proposed by (Yerima and Van Ranst 2005a). Soil samples were collected from the six main land use systems described above (Natural forest, natural savanna, farmland, afforested land, grazing land and Eucalyptus plantation). Under each land use, soil samples were obtained from a plot, with dimensions of 20 × 20 m (400 m2), at a constant depth of 0–15 cm, following a “Z-layout” design. Soil samples were taken from the four corners and center of each layout. Approximately 1 kg of composite sample was collected from each location and placed into plastic bags. They were then transported, air-dried at room temperature, crushed, homogenized, and passed through a 2 mm sieve before laboratory analysis. A total of 90 soil samples (six land use types x five replicates per sample plots x one soil depth class: 0–15 cm × three altitudinal zones) were collected within the study area, from June to July 2015, for analysis. Undisturbed soil samples were taken with a core sampler that was 7.5 cm long and 6.4 cm in diameter for bulk density determination. Soil quality indicators comprising of the three standard groupings including: physical (moisture content, bulk density); chemical (pH, total nitrogen, available phosphorus, exchangeable bases, cation exchange capacity, C/N ratio, electrical conductivity) and biological (organic matter content) proposed by Yerima and Van Ranst (2005a), for soils in the tropics, were selected for analysis. The soils were analysed at the Soil Science Laboratory at the University of Dschang, following standard procedures and methods as described below:
Physical properties
Moisture content (MC) was calculated using the gravimetric method where soil samples were placed into ceramic crucibles and weighed to get the fresh weight and then oven-dried at 105 °C to constant weight for about 24 h and the dry weight recorded. These values were then used to calculate the moisture contents of the soils using the formula:
where MC soil moisture content (%), fw fresh weight (g) of soil sample, dw dry weight (g) of soil sample.
Bulk density was measured following the core method described by Yerima and Van Ranst (2005a, b), where samples contained in the core rings of known weight, height and diameter were weighed and the fresh weights recorded, then oven dried at 105 °C for 24 h, after which the dry weights were also recorded. The volume of the core was determined using the following formula:
where V = volume of core (cm3); π = 3.14; r = radius = diameter/2 (cm); and h = height (cm).
Soil bulk density was then determined using the following formula:
where BD bulk density, M mass of oven dry soil (g) and V volume of core (cm3).
Soil textural fractions (sand, silt, and clay) were analyzed following the Bouyoucos hydrometer method, where 15 g of 2 mm air-dried soil was weighed into 500 ml beakers and subjected to treatments for removing organic matter using H2O2, followed by dispersing the soils with sodium hexametaphosphate (Pauwels et al. 1992). The resulting compositions were placed on a mechanical shaker and allowed to shake for 3 h. Suspensions were then transferred into sedimentation measuring cylinders and brought to the 1000 ml mark using distilled deionized water. The mixtures were well stirred using a mechanical rotator to bring the particles into suspension. A hydrometer was then used to obtain readings after 40 s (first reading, R1) and 2 h, (second reading, R2) respectively. Calculations were done using the following equations:
The first reading (R1) gave the silt + Clay content
Therefore, % Silt = A − B while % Sand = 100 − % (Silt + Clay).
After getting the percentage sand, silt and clay, the soil textural triangle was used to classify the soil texture.
Chemical analysis
Moisture correction factor was calculated using the following formula:
where mcf moisture correction factor and MC soil moisture content (%).
Soil pH was measured both in water and KCl (a 1:2.5 soil: H2O/KCl ratio) using a glass electrode Thermo-Russel pH meter, calibrated using buffer solutions of pH 7 and 4 for H2O and KCl, respectively. Soil total nitrogen (TN) was determined using the Kjeldahl distillation method (Pauwels et al. 1992) where 1 g each of air-dried soil samples were placed into 500 ml Kjeldahl flasks, followed by the addition of 5 ml of distilled deionized water. A scoop of digestion accelerator mixture (sulphuric–salicylic acid mixture) was then added to each flask. Five milliliter of concentrated H2SO4 was added and the mixture was allowed to digest for 1 h in a fume cupboard by gentle heating until the vigorous effervescence subsided to ensure that the digest was free of charred organic matter. The digest was then allowed to cool followed by addition of 20 ml of distilled water. After ensuring settlement, the supernatant solutions were decanted into 100 ml volumetric flasks. The process was repeated and 5 ml of 40% NaOH and 100 ml of distilled water were added. The distillate was collected and mixed with 5 ml of the boric acid (H3BO3) solution-indicator mixture. The distillate was titrated with 0.01 M H2SO4 from green to pinkish endpoint and the titer value recorded. The soil TN was calculated using the formula:
where T ml of standard acid with sample titration, B ml of standard acid with blank titration, M molarity of sulphuric acid, S weight of soil sample (g), and 2.8 a constant.
Available phosphorous (Av.P) was determined following Bray-II method where solutions of 0.1 N HCl and 0.03 N NH4F were used to extract available phosphorus from the soil samples. Phosphorus was determined colorimetrically using the ammonium molybdate blue method. In this process, 2 g of < 2 mm air-dried soil samples were weighed into clean dried test tubes. Fourteen ml of the extracting solution was added and vigorously shaken for 30 s, using an electrical shaker and immediately filtered into other previously prepared test tubes carrying funnels and Whatman # 42 filter papers. For colour development, 5 ml of the extract and standards were pipetted into a set of test tubes. Then, 5 ml of colour development reagents (Ascorbic acid), and mixed reagent (Ammonium molybdate, Potassium Antimony tartrate and sulphuric acid) were added to each test tube. The samples were allowed to stand for 15 min for complete color development. Absorbance was then measured using a colorimeter, set at a wavelength of 882 nm.
Exchangeable bases (Ca2+, Mg2+, K+, and Na) were extracted using 50 ml of ammonium acetate (1.0 M NH4OAc) solution buffered at pH 7. Potassium (K+) and sodium (Na+) in the extract were determined using the flame photometer while magnesium (Mg2+) and calcium (Ca2+) in the extract were determined by complexometric titration.
Cation exchange capacity (CEC) was determined following the extraction method were soil samples were also saturated with ammonium acetate buffered at pH 7 to displace the exchangeable bases as explained in the case of the determination of exchangeable bases. However, for CEC determination, the column of each sample was then thoroughly washed with 95% alcohol to discard excess ammonium acetate that saturated the complex. This was verified using Nessler's reagent. Sixty milliliter of KCl was then added to each tube to allow potassium to replace ammonium ions on the exchange complexes. The filtrate containing the NH4+ ions was collected into 100 ml volumetric flasks and brought up to 100 ml mark by the addition of KCl. Twenty-five milliliter of each sample were transferred into distiller’s tubes and NaOH added followed by 2–3 drops of the end-point indicator, phenolphthalein. Forty ml of boric acid were placed into conical flasks and distilled water added to the 100 ml level. Each sample was distilled and the distillate in the conical flasks titrated with 0.01 M H2SO4 from a burette. The CEC was then calculated using the following formula:
where V the volume of sulfuric acid added to the sample, Vo the volume of sulfuric acid added to the blank, and 16 a constant.
Electrical conductivity (EC) was determined following standard procedures proposed by Pauwels et al. (1992) where a 1:5 soil-solution ratio (10 g of < 2 mm soil and 50 ml distilled ionized water) was agitated for an hour and the readings from an EC meter, calibrated with 0.01 N KCl, recorded.
Exchangeable acidity (EA) (H+ + Al3+) was determined for samples with pH < 5.5. In the procedure, 1 N KCl was added to the flasks containing 1 g of < 2 mm soil sample for displacement of the Al3+ + H+ ions. EA was then determined by titration of extracts with 0.02 N NaOH for the neutralization of the acidic ions in the extract using three drops of phenolphthalein as an indicator. The exchangeable acidity was then calculated using the following formula:
where EA the exchangeable acidity (H+ + Al3+) (meq 100 g−1), t the exact molarity of NaOH used, Vx the volume of NaOH added to the sample, Vo the volume of NaOH added to the blank.
C/N ratio was obtained by taking the ratio of S percent carbon to nitrogen in each sample as follows:
where C/N the ratio of carbon to nitrogen, SOC the concentration to carbon (%) in the soil sample, TN the concentration of total nitrogen (%) in the soil sample.
Soil organic carbon (SOC) was determined following the Walkley and Black wet oxidation method (Walkley and Black 1934) where 5 g each, of the soil samples, were first placed into a wide-mouth Erlenmeyer flask, followed by the addition of 10 ml of 1 N Potassium dichromate (K2Cr2O7) into each flask, in a fume cupboard. Twenty milliliter of concentrated sulphuric acid (H2SO4) was then added to each flask and the solution mixture was allowed to stand for at least 30 min. One hundred and fifty milliliter of distilled water was then added to each flask followed by one drop of the indicator Barium diphenylamine sulfate. The solution was then titrated with ferrous sulfate solution while stirring the mixture to the end-point (when the brown colour changes sharply to green). The amount of ferrous sulfate required for each sample for complete combustion was read and recorded. The difference between the amounts of FeSO4 added for the samples compared to that added to the blank titration determines the amount of combusted carbon. A correction factor of 0.39 was used to account for the incomplete combustion of organic carbon. The percent carbon content of the soil samples was then calculated using the following formula proposed by Van Reewijk (2002):
where M the molarity of ferrous sulfate solution (from blank titration), V1 the ml of ferrous sulfate solution required for blank, V2 the ml of ferrous sulfate solution required for sample, S the weight of the air-dry sample in gram, mcf the moisture correction factor, while 0.39 a constant.
Statistical analysis
The data were analyzed using descriptive and multivariate statistics using SPSS version 21.0 for windows. Data distributions were checked for normality and then log10 transformed when they were skewed. Pearson’s correlation was used to analyse the relationship between selected soil physical and chemical properties. The means and standard deviations of the selected parameters were compared to show their distribution across different land use/land cover systems and altitudes in the region. Analysis of variance ratio (ANOVA) was used to test for significant differences between the means, with treatments (land use) and group (elevation) set as the independent variables, to determine which parameters varied significantly with each treatment (Brejda et al. 2000a, b).
Results and discussion
Descriptions and characteristics of soils in the study area
In Awing and Santa (high altitude), the soils were presumably Inceptisols because they were young soils with some colour changes and have rocks at very shallow depths. In Bamenda (mid-altitude) and at the Yongka Park in particular, the soil type varied and was found to include: Oxisols, those that possessed loamy and clayey texture, slightly acidic, contain little or no weatherable minerals, traces of water dispersible clay and extreme weathering of most minerals other than quartz to kaolinite and free iron oxides, and have low CEC (< 16 cmol (+)/kg); Inceptisols, those that have rocks at vey shallow depth, and were young soils; and Entisols, those that lack pedogenic horizons and occur on slopes. The Oxisols presented their characteristic reddish-brown colour, indicating the presence of oxides of Fe, while Entisols were observed at the foot of the slope, in areas with frequent water saturation and on shoulder slopes where the rate of erosion was presumably higher than the rate of formation of pedogenic horizons. Hence, a characteristic lack of genetic horizons (Fig. 8).

(Source: Yerima (2011))
Soil profiles showing; Entisol with thin A horizon (a); inceptisol (b); inceptisol with thick A horizon (c) and Entisol exposing stony horizons that constraint plant growth (d) in the North West Region
Yerima (2011) stated that these soils differ in such characteristics as texture, effective depth, gravel content, compactness and water infiltration rates. At Ndop, (low altitude), the soils were observed to be rich in alluvial deposits and this is corroborated by the fact that Ndop plain is an intermontane basin in the Bamenda Highlands. The soil types observed here include; Inceptisols, Entisols, and Oxisols. It was suggested that due to these variations in soil types across elevation, important differences in physical, chemical and biological characteristics exist at regional scale.
Effect of LULC change on soil physical properties
Table 1 presents the means (± SD) while Table 2 presents a summary of ANOVA for soil MC, BD and particle size distribution in the soil surface layer (0–15 cm) across different LULC systems and altitudes. The results for the individual soil quality attributes include:
Soil moisture content (MC)
The results also show that soil moisture content significantly varied with land use types (P < 0.01) and with elevation (P < 0.01) (i.e. MC increases with increase in altitude (Table 1). Generally, at all the elevations, the soils under Eucalyptus saligna plantation had the highest moisture contents compared to the other land uses/land cover systems except for those under natural forest land cover systems at the high and low altitudes (Fig. 9). These results corroborate with the findings of Getachew et al. (2012).

Estimated marginal means of soil moisture content (%) in the soil layer of 0–15 cm across different land use/land cover systems and altitudes
Soil moisture content (%) at the surface (0–15 cm) showed significant differences (P < 0.01) between the soils of the different land uses/land cover for all the elevation (Table 2). At high altitude, the mean soil MC (%) differed significantly (P < 0.01) between farm and natural forest only. The study show empty patches with predominantly fern plants under Eucalyptus plantations compared to a dense, continuous layer of undergrowth including Cynodon dactylon, Podocarpus sp. found under native forest stands (Fig. 10). At mid-altitude, the mean soil MC (%) under natural savanna forest cover differed significantly (P < 0.01) from those under E. saligna plantation. Also, the mean soil MC (%) under the E. saligna plantation differed significantly (P < 0.01) from those under the afforestation plantations in the Yongka Western Highlands Research Garden Park and grazing land use systems. At low altitude, the mean soil MC (%) under Natural Forest cover differed significantly (P < 0.01) from those under all the other land use systems except E. saligna plantation. Also, the mean soil MC (%) under natural savanna forest cover and grazing land use differed significantly (P < 0.01) from those under natural forest. Generally, the lower MC (%) in soils under E. saligna plantation compared to those under natural forest may be due to the observed sparse or absence of undergrowth (Fig. 11).

Estimated marginal means of bulk density (g/cm3) in the of 0–15 cm soil layer across different land use/land cover systems and altitudes

Eucalyptus plantation showing sparse undergrowth (a); absence of undergrowth with light canopy (b); native forest showing dense undergrowth (c); dark forest canopy with mushroom growing on plant remains (d)
In agreement with Aweto and Moleele (2005), the sparse or absence of undergrowth and the light canopy of Eucalyptus trees in plantations can lead to higher rate of soil water evaporation, whereas the dense undergrowth in the native forest could lower soil temperature and reduce evaporation to enhance soil water infiltration. These results also agree with the findings of Cao et al. (2010) who reported low soil moisture contents, ranging from 20.2 to 30.5% in the topsoil (0‒10 cm) under Eucalyptus spp. plantations, aged from 3 to 13 years in China. The sparse or absence of undergrowth is an indication of reduced biodiversity under Eucalyptus plantations. Although House (1992) stated that the presence or absence of understorey is a factor of the density of the stand and of the rainfall regime, Zerga (2015) reported a similar finding in Ethiopia and indicated that the dominant leaf litterfall under Eucalyptus stands prohibits the growth of other plants due to its allelopathic effect. The latter explained that chemicals from the leaves of Eucalyptus trees reduce the soil nutrients that are necessary for undergrowths, hence, enhancing soil degradation through erosion, nutrient and water depletion. It was also observed in this study that the establishment of eucalyptus plantation not only suppresses undergrowths but also affects the performance of cultivated crops adjacent to the plantation stands, probably due to this allelopathic effects.
Soil bulk density
The results also showed that soil bulk density significantly varied with land use types (P < 0.01) and across elevation (P < 0.01) with significant interactions between subject effects (land use and elevation) (P < 0.01) (Table 2). Generally, at all altitudes, the soil under natural forest had the lowest bulk density (g/cm3) compared to the other land use s/land cover systems, followed by the soil under E. saligna plantation, while soil under farmland and grazing land had a higher bulk density (Fig. 10). These results corroborate the findings of Getachew et al. (2012) and further depicts the altitudinal variations. In terms of absolute values however, the results for this research showed that soils under farmland had the highest bulk density (0.894 and 1.450 g/cm3), while those under the natural forest had the lowest bulk density, (0.517 and 0.790 g/cm3) in the top 0–15 cm soil layer at high and low altitudes respectively. At mid-altitude, soils under grazing land use system had the highest bulk density (1.185 g/cm3) while those under the natural forest land cover system had the lowest bulk density (0.570 g/cm3) in the top 0–15 cm soil layer. It can be suggested that deforestation and subsequent tillage practices resulted in soil compaction, low infiltration and hence increased in bulk density for surface soil in North West Region of Cameroon. Similar finding has been reported in other areas around the world (Getachew et al. 2012; Javad et al. 2014).
Nonetheless, bulk density (g/cm3) showed a significant difference (P < 0.01) at all altitudes, between the soils of the different land uses/land cover system for the surface 0–15 cm soil layer (Table 1). At high altitude, bulk density (g/cm3) differed significantly (P < 0.01) between the soils under natural forest and all the other land use/land cover systems except E. saligna plantations. However, at this altitude, bulk density (g/cm3) showed no significant difference between soils under natural savanna and those under farmland, grazing land, and E. saligna plantation, respectively. Also, bulk density (g/cm3) showed no significant difference (P > 0.01) between the soils under farmland and E. saligna plantations. At mid-altitude, bulk density (g/cm3) also showed significant differences (P < 0.01) between the soils under natural forest and all the other land use/land cover systems except natural savanna and E. saligna plantations. At this altitude, bulk density (g/cm3) showed no significant difference (P > 0.01) between soils under natural savanna and all other LULC systems except grazing land. At low altitude, bulk density (g/cm3) differed significantly (P < 0.01) between the soils under natural forest and all the other land use/land cover systems except those under the E. saligna plantation. However, at this altitude, bulk density (g/cm3) showed no significant difference between soils under natural savanna and those under grazing land.
Soil bulk density represents a measure of soil compaction and health. Kakaire et al. (2015) stated that a higher soil bulk density means that less amount of water is held in the soil at field capacity, while a lower soil bulk density means soils are less compacted and are able to retain more water. These results corroborate the findings of Ravina (2012) who reported a higher soil bulk density of 1.24 g/cm3 under Eucalyptus spp. plantation compared to 0.66 g/cm3 under a native forest in a Brazilian soil (0–15 cm). In addition, Kolay (2000) indicated that bulk density of productive natural soils generally ranges from 1.1 to 1.5 g/cm3. Since the soil bulk densities found in all the land uses were lower and within this range, it can be concluded that the soil productivity in the area is good. Furthermore, since the soil bulk densities found in the Eucalyptus plantation, grazing land, and farmland were higher than those under native forest, it can be concluded that the conversion of forest to Eucalyptus plantations, farmland and grazing land increases soil bulk densities probably due to increased soil compaction. The findings from the study confirm those of Aweto and Moleele (2005), who concluded that Eucalyptus spp. plantations increased soil bulk density more than the native forest in Botswana.
Particle size distribution
Although not significant, the results show that particle size distribution varied with LULC systems across the different altitudes. However, the interactions between subject effects were only significant (P < 0.01) for sand and silt contents (Table 2).
Sand content
At high altitude, the soils under both natural savanna and grazing land use systems had the highest percentage of sand content (37.5%), while those under natural forest and cropland had the lowest (28.5 and 28.4%, respectively) (Fig. 12). This is probably due to the fact that there was no existing land uses where savanna vegetation was protected against disturbance either by burning or grazing in the area. The lower sand content under farmland may be attributed to tillage practices and differential segregation by erosion on inceptisols. However, at this altitude, mean percentage sand content at the surface (0–15 cm) layer showed no significant difference (P > 0.01) between the soils under all the land use/land cover systems. At mid-altitude, the soils under afforestation land use systems in the Yongka Park had the highest percentage of sand content (36.9%) while those under grazing land had the lowest (32%). Although the grazing land had low sand proportions at this altitude, mean percentage sand content at the surface (0–15 cm) layer showed no significant difference (P > 0.01) between the soils under all the land use/land cover systems. This can be due to the fact that the soils are oxisols, originating from a granitic parent material, characterized by colloidal fractions and dominated by low activity clays and sesquioxides (Yerima and Van Ranst 2005b).

Estimated marginal means of sand (%) in the 0–15 cm soil layer across different land use/land cover systems and altitudes
The soils under afforestation land use system in the park are varied, which is probably a representation of the different stages of soil development. The park area was formerly a grazing land, with an unstable geomorphic surface, which resulted in soil erosion and exposure. The gullies observed under the afforestation stand with Artocarpus heterophyllus (Jackfruit) is associated with the concentration of runoff water from the road (Fig. 13).

Artocarpus heterophyllus afforested stand (a); gully erosion under the Artocarpus heterophyllus stand (b)
At low altitude, the soils under farmland had the highest percentage of sand content (41.9%) while those under grazing land use systems had the lowest (31.5%). Again, at this altitude, mean percentage sand content at the surface (0–15 cm) layer showed no significant difference (P > 0.01) between the soils under all the land use/land cover systems. There was no existing land uses where natural forest cover and savanna vegetation was protected against disturbance either by burning or grazing in this area. Therefore there were high similarities with nonsignificant differences in soil properties under the different land uses in this area. Generally, the results showed that sand content increased when converting natural forest to cropland, and this is most likely resulting from the preferential removal of clay and silt and residual accumulation of sand in soil surface resulting from preferential segregation and evacuation of the smaller silt and clay particles, by accelerated water erosion. These results are in agreement with the findings of Javad et al. (2014) who attesting to the results of Ayele et al. (2013) reported that sand content is a physical parameter affected by soil erosion and, hence, can be measured and used as an indicator for evaluating soil degradation under different land use systems.
Silt content
At high altitude, the soils under the natural forest land cover system had the highest percentage of silt content (57%), while those under farmland was intermediate (56%) (Fig. 14). Those under the natural savanna, grazing land and E. saligna plantation had the lowest percentages and of equal values (48%). However, at this altitude, mean percentage silt content at the surface (0–15 cm) layer showed no significant difference (P > 0.01) between the soils under all the LULC systems.

Estimated marginal means of silt (%) in the 0–15 cm soil layer across different land use/land cover systems and altitudes
It was noticed that the area under natural savanna forest cover at high altitude was also used for grazing. The frequent burning of grass during the dry season by cattle herdsmen and trampling effects due to overgrazing is suggested to have influence soil structure as burning destroys and removes soil organic matter, thereby loosening of soil particles and encouraging water erosion on gentle slopes. In addition, the E. saligna plantation here was located on steep slopes, with abundant leaf litter and no vegetation understory. It can be suggested that the silt content under natural savanna, grazing land and E. saligna plantation were lower due to accelerated water erosion. The lack of ground cover and understory may have contributed to initiating erosion which selectively washes away clay and silt. At mid-altitude, the soils under grazing land use systems had the highest percentage of silt content (53%) while those under the afforestation land use projects in the Yongka Park had the lowest percentage (47%). At this altitude, mean percentage silt content at the surface (0–15 cm) layer showed no significant difference (P > 0.01) between the soils under all the land use/land cover systems. The soils under the afforestation stand were located on the shoulder of the slope and signs of severe erosion (rills and gullies) were observed, compared to those of grazing land. Geologically, on a midslope, the rate of soil erosion is increased and the topsoil layer is greatly reduced. At low altitude, the soils under the E. saligna plantation had the highest percentage of silt content (52%) while those under farmland use systems had the lowest (42%). At this altitude, mean percentage silt content at the surface (0–15 cm) layer showed no significant difference (P > 0.01) between the soils under all the land use/land cover systems. Here the soils under the E. saligna plantation were located on the toe slope (flat surface) and signs of severe deposition (siltation, floods and stagnant water bodies) were generally observed in the area after heavy rainfall. Geologically, on the toe slope, the rate of soil erosion is minimal and the topsoil layer is mostly comprised of mineral deposits transported principally by water (erosive agent) from top and shoulder slopes. However, soils under farmland use systems are prone to erosion comparatively.
Clay content
The result shows that at high altitude, the soils under farmland use system had the highest percentage of clay content (15%), while those under E. saligna plantation was intermediate (14.6%) (Fig. 15). Those under the natural savanna, natural forest, and grazing land had the lowest percentages and of equal values (14%). At this altitude, mean percentage clay content at the surface (0–15 cm) layer showed no significant difference (P > 0.01) between the soils under all the land use/land cover systems.

Estimated marginal means of clay (%) in the 0–15 cm soil layer across different land use/land cover systems and altitudes
At mid-altitude, the soils under the afforestation land use projects in the Yongcak Park had the highest percentage of clay content (17.3%) while those under the natural savanna land cover had the lowest percentage (13.5%). At this altitude, mean percentage clay content at the surface (0–15 cm) layer showed no significant difference (P > 0.01) between the soils under all the land use/land cover systems. At low altitude, the soils under the natural forest land cover system had the highest percentage of clay content (18.5%) while those under E. saligna plantation had the lowest (12.8%). At this altitude, mean percentage clay content at the surface (0–15 cm) layer showed no significant difference (P > 0.01) between the soils under all the land use/land cover systems. However, the percentage clay content was relatively lower than those of sand and silt in all the land use/land cover systems across the different altitudes. When fine particles of soils are high, EC may increase. However, increased EC in soils is predominantly due to the presence of soluble salts (Yerima and Van Ranst 2005a), but which is not found in the study area, and this may cause instability of soil structure.
Soil texture
Generally, the results show that the soil texture in the study area ranged from loam to silt loam, which is very good for agriculture. Specifically, the result shows that on one hand, the soil texture under natural vegetation cover and farmland use systems in the NW region changed from silt loam to loam, as elevation decreases (Table 3). On the other hand, the soil texture under grazing land use system and E. saligna plantation changed from loam to silty loam as elevation decreases. This is suggested to be due to pedogenic processes including degradation (surficial erosion) and aggradation (cumulization) (Yerima and Van Ranst 2005a).
Ideally, the conversion of forest into cropland is known to deteriorate soil physical properties and making the land more susceptible to erosion since soil structure (macroaggregates) is disturbed. Soil erosion can modify soil properties by reducing soil depth, changing soil texture, and by the loss of nutrients and organic matter (Lobe et al. 2001).
Effects of land use change on soil chemical properties
Generally, the chemical properties of soils show variations under the different land uses across the different altitudinal zones of the study area. Table 4 presents the mean (± SD) while Table 5 present the summary of ANOVA for soil pH, SOC, TN, and Av.P in the 0–15 cm soil layer across different LULC systems and altitudes in the study area.
Effects of land use change on soil pH H2O, pH KCl and Δ pH
The results also showed that soil pH significantly varied with land use types (P < 0.01) and across elevation (P < 0.01) with significant interaction between subjects effects (P < 0.01) (Table 4). According to Landon (1991) ratings, the soil pH for all the land uses in this study were low to medium (slightly acidic), probably due to the parent material (granitic) which is acidic in nature and are characteristic of oxisols. The results show that the soil under farmland use had relatively lower pH H2O and pH KCl values and lower net charges compared to those of the other land uses/land cover systems in the area. In general, soil pH decreased with increase in altitude (Figs. 16, 17 and 18). This may be largely due to the use of chemical fertilizers including urea, potash, and N, K, P (20:10:10), as well as the high use of weedicides such as roundup, by farmers in the area which contain high amounts of cations that helps to neutralise the negative charges. The results show that there is a net negative charge for all the soils in the area under study. The weathering of the granitic parent material, which results in iron and aluminum oxides, as well as leaching of more soluble soil minerals and basic cations, may have caused the slight acidity of the soils in the study area. The net charge was less negative under native forest systems compared to grazing, savanna, Eucalyptus plantation and afforestation systems.

Estimated marginal means of pH H20 values in the 0–15 cm soil layer across different land use/land cover systems and altitudes

Estimated marginal means of pH KCl values in the 0–15 cm soil layer across different land use/land cover systems and altitudes

Estimated marginal means of net charge (Δ pH) values in the 0–15 cm soil layer across different land use/land cover systems and altitudes
At high altitude, the soils under farmland use system had the lowest mean pH value (5.2) while those under natural savanna and grazing land had the highest mean pH value (5.9). At this altitude, mean pH values at the surface (0–15 cm) layer showed a significant difference (P < 0.01) between the soils under natural forest and natural savanna, as well as between those under farmland, natural savanna and grazing land use systems. The results also show that the soils under natural forest cover and E. saligna plantation had a relatively lower pH values (pH < 5.5) in this area. This is because Low pH slows down the breakdown of litter due to low microbiological activity (Yerima and Van Ranst 2005a).
Similarly, at mid-altitude, the soils under farmland use systems had the lowest mean pH value (5.4) followed by those under E. saligna plantation (5.5), while those under natural savanna and grazing land had the highest mean pH value (6.1). This similarity in pH values can be due to the fact that the land use under natural savanna was also used for cattle grazing. At this altitude, mean pH values at the surface (0–15 cm) layer showed a significant difference (P < 0.01) between the soils under farmland and grazing land use systems, as well as between soils under E. saligna plantation and grazing land use system. The relatively high pH values under grazing land may be due to the high cow dung wastes deposited on the fields. Interestingly, at low altitude, the soils under E. saligna plantation had the lowest mean pH value (5.7) while those under natural forest and natural savanna had the highest mean pH value (6.5). Humphrey and Amawa (2014) also reported a similar finding in the study area. At this altitude, mean pH values at the surface (0–15 cm) layer showed a significant difference (P < 0.01) between the soils under natural vegetation (forest and savanna) cover and those under farmland and E. saligna plantation.
Generally, the slightly acidic nature of the soils under all the land use/land cover systems may be due to the weathering of granitic parent materials and the intense leaching of basic cations. Also, the low pH values in farmland could be due to high tillage frequency, high rates of inorganic fertilizer applications (especially ammonium fertilizers), low amount of organic matter as a result of erosion or due to aluminum toxicity. In fact, the significant differences of mean pH values at the surface (0–15 cm) layer between soils under cultivated land and those under natural vegetation across different altitudes indicates that the conversion of natural vegetation cover (forest and savanna) to farmland decreases pH of the soil, with increased efficiency as altitude increases, in the North West Region of Cameroon. This result contradicts the findings of Kizilkaya and Dengiz (2010) who reported a significant increase of pH from 6.03 in soils under natural forest to 7.71 in soils under cultivated land in Turkey. Although these are two different environments, this difference may be due to the fact that sustainable agricultural land management practices such as the application of organic manure, mulching, rotation and limited tillage were adopted in the cultivated land in Turkey while those in our study area did not adopt sustainable land management practices. It could also be due to the high basic fertilizer applications. Low soil pH impeds the CEC of the soil by altering the surface charge of colloids (finest clay particles and soil organic matter) (McCauley et al. 2005). Low CEC implies that soil will have less exchangeable cations required as crop nutrients, nutrients are weekly adsorbed and hence may be leached out.
Effects of land use change on soil organic carbon (SOC) and organic matter (SOM)
The results also showed that SOC significantly varied with land use types (P < 0.01) and with elevation (P < 0.01) but the interaction between subjects effects was not significant (P > 0.01) (Table 5). Following the ratings by Yerima and Van Ranst (2005a), the results show that all the soils under the different land use systems across the different elevations were medium to high in SOC content. However, the percentage of OC concentration for soils under natural forest as well as those under E. saligna plantations were higher compared to all the other land use systems at all elevations (Fig. 19). In addition, the results indicate that OC in soils increased with increase in elevation in the N.W region. These results corroborate the findings of Yerima and Van Ranst (2005a).

Estimated marginal means of soil organic carbon (%) in the 0–15 cm soil layer across different land use/land cover systems and altitudes
At high altitude, the soils under natural forest land cover system (protected forest) had the highest mean soil organic carbon content (6.50%) followed by those under E. saligna plantations (5.79%) (Table 4). Those under farmland use systems had the lowest mean percentage of soil organic carbon content (3.31%). At this altitude, the mean percentage of SOC content at the surface (0–15 cm) layer showed a significant difference (P < 0.01) between the soils under natural forest and farmland. Also, the results showed a significant difference (P < 0.01) between the soils under E. saligna plantations and those under farmland. However, there were no significant differences (P > 0.01) between soils under natural savanna and grazing land. This may be due to the fact that the natural savanna land cover systems were observed to be subjected to conditions similar to grazing land use (burning and cattle grazing) in the area (Fig. 20). More so, the relatively higher soil organic carbon contents at higher elevations may be due to a slow down in the rate of organic matter mineralization associated with low temperatures and decrease microbial activity.

Sheep and cattle grazing on grazing land (a); cattle grazing on Eucalyptus plantation (b); fire disturbance on grazing land (c); burnt tree trunks showing evidence of fire disturbance on Eucalyptus plantation (d)
At mid-altitude, the soils under natural forest land cover systems still had the highest mean SOC content (4.58) followed by those under E. saligna plantation (3.46%) (Table 4). Although the mean percentage of SOC contents for soils under farmland use systems were low (3.04%), those under the natural savanna land use systems had the lowest mean percentage (2.10%) compared to all the other land use/land cover systems. However, at this altitude, the mean percentage of SOC content at the surface (0–15 cm) layer showed significant differences (P < 0.01) between the soils under natural forest cover and savanna, afforestation, and grazing land use systems.
Although the natural savanna land cover system was within the Yongka Garden Park, the results showed that the soil was low in soil organic carbon content compared to those under the natural forest cover. This can be suggested to be due to the fact that the land was previously used for cattle grazing, and soils in the area were generally low in organic matter before the establishment of the park (9 years old, after many years of cattle grazing), due to unsustainable land use practices and soil degradation. Results from interview with researchers from the park, on the land use history of the area reveals that after several years of intensive exploitation, prior to the establishment of the Park, mining of the soil organic carbon and nutrient stocks was an issue, which led to a decline in fertility, compaction of surface soils and slow and poor regeneration of vegetation on land left for fallow. They added that issues of water and fuelwood scarcity in the nearby community were prominent at the time. This result is in line with the findings of Humphrey and Amawa (2014), who stated that intensification of agriculture and the use of inappropriate cultural practices including the cultivation on fragile (steep) hill-slopes, setting of bushfires, overgrazing by cattle, building of settlements, and increased consumption of the regions fuelwood, has lead to environmental and soil degradation in the area. In fact, Yerima (2011) elucidated that soils in the park are acidic in nature, have low nutrient contents with compact and dense structures that are an impediment to plant growth. These are tangible reasons attracting afforestation initiatives and other sustainable land use practices that promote conservation of biodiversity in the area. Hence, it is unarguable that the SOC values reported in this study only presents a picture of the ongoing land regeneration efforts that may require a longer period of time to show its actual image.
At low altitude, the soils under natural forest and those under natural savanna land cover systems had the highest mean soil organic carbon content (3.10%) followed by soils under E. saligna plantations (3.05%) (Table 4). Those under farmland use systems had the lowest mean percentage of soil organic carbon content (1.83%). However, at this altitude, the mean percentage of soil organic carbon content at the surface (0–15 cm) layer showed no significant differences (P > 0.01) between the soils under all the land use/land cover systems. This can be attributed to the higher soil temperatures, which increases the rate of mineralization due to increase in microbial activity. In addition, the area is located at the toe slope where the difference in slope gradient influences erosion, flooding and subsequent deposition of inorganic materials downslope. Deposition of inorganic materials through erosion buries the topsoil which is normally rich in organic matter, hence the true picture of soil organic carbon is blurred at low altitude. As the soils under natural savanna were subjected to grazing practices, it is possible that the soil samples collected were influenced by animal waste deposition, hence the high SOC value recorded. Furthermore, cultivated soils generally have low organic matter content compared to native ecosystems, since cultivation increases aeration of soil, which enhances decomposition of soil organic matter (Kizilkaya and Dengiz 2010).
These results conform to the assertion that SOC stocks are sensitive to land use and cover change (Guo and Gifford 2002; Wiesmeier et al. 2012) probably because of the alterations of both carbon inputs (amount and quality of litter mass) and losses (decomposition and mineralization). Soil carbon improves the physical properties of soil, increases the cation exchange capacity (CEC) and water-holding capacity of the soil, and contributes to the structural stability of soils by helping to bind particles into aggregates (Leeper and Uren 1993). It can be suggested that, anthropogenic activities that accentuate SOC loss in the soil including tillage (hoeing, plowing), biomass burning, residual removal, overgrazing, and drainage, are responsible for the distribution of SOC contents observed, at different elevations, under the different land use/land cover systems in the N.W region.
Since carbon is a fundamental constituent of soil organic matter (Ogle et al. 2005), the trends in effects of soil organic carbon under the different land use/land cover systems in the N.W region mirrors that of SOM and hence carbon storage of soil. It is well recognized that SOM increases structural stability, resistance to rainfall impact, the rate of infiltration and faunal activities (Roose and Barthes 2001). SOM, of which carbon is a major part, holds a great proportion of nutrients cations and trace elements that are of importance to plant growth. According to Leu (2007), it prevents nutrient leaching and is integral to the organic acids that make nutrients accessible to plants while acting as a soil buffer to resist strong changes in pH. It is widely accepted that the carbon content of soil is a key element in its overall health (Yerima and Van Ranst 2005a).
Effects of land use change on soil total nitrogen
Soil total nitrogen is typically used as an important index for soil quality evaluation and reflects the soil nitrogen status (Sui et al. 2005). Similar to soil organic carbon, soil total nitrogen content (%) also exhibited obvious differences at the surface (0–15 cm) layer under different land use/land cover systems across the three elevations (Table 4). The results also showed that soil total nitrogen did not vary significantly with land use types (P < 0.01), but varied significantly with elevation (P < 0.01). However, the interaction between subjects’ effects was not significant (P < 0.01) (Table 4). Generally, the results show that soil total nitrogen contents increase with an increase in elevation in the N.W region (Fig. 21).

Estimated marginal means of nitrogen (%) in the 0–15 cm soil layer across different land use/land cover systems and altitudes
The study showed that at high altitude, both the soils under savanna and grazing land use systems had the highest mean soil total nitrogen content (0.36%) followed by those under natural forest cover (0.30%), while those under farmland system had the lowest. At this altitude, mean soil total nitrogen at the surface (0–15 cm) layer showed no significant difference (P > 0.01) between the soils under all the land use/land cover systems. It was observed that pasture density under grazing land use systems at the higher altitude was higher compared to that at lower altitudes. This has a direct relationship with organic matter content. Again, the similarities in results between savanna and grazing land may probably be due to the similarities in observed conditions (burning and cattle grazing) under the two land use systems in the area. The high amounts of nitrogen in soils under grazing land may be due to the burning of grass that produce ash which is rich in nitrogen and other major nutrients. It is well known that fire simulates cycling of nitrogen and thus, relatively high amounts of nitrogen in the ash could be found under such disturbed land use sites. Grazing land is also subjected to deposition of cow dung waste, which enhances the soil organic matter content. A high soil organic matter content strongly correlates with high nitrogen content. However, strong fires on sandy soils may give long-lasting loss of soil surface humus and nitrogen, which may lead to site impoverishment. Also, studies have suggested that grazing can promote nutrient cycling because livestock feces and urine provide large amounts of soluble nitrogen that is readily available to plants for growth and livestock excretions can promote soil organic matter (SOM) mineralization rates (McNaughton et al. 1997).
At mid-altitude, the soils under natural forest land cover system had the highest mean soil total nitrogen content (0.29%) while those under farmland had the lowest (0.18%). At this altitude, mean soil total nitrogen at the surface (0–15 cm) layer showed no significant difference (P > 0.01) between the soils under all the land use/land cover systems. Although the level of nitrogen fertilizer use as agric-input was high in the region, the total nitrogen contents are low in farms, probably because of the poor nitrogen retention ability of the soils under farmland uses and the loss of organic matter which is a source of nitrogen. At low altitude, the soils under natural forest land cover systems also had the highest mean soil total nitrogen content (0.28%), while those under savanna land use had the lowest values (0.19%). At this altitude, mean soil total nitrogen at the surface (0–15 cm) layer showed significant differences (P < 0.01) only between the soils under natural forest vegetation and those under natural savanna land cover systems. This can be due to the fact that soils under savanna cover were disturbed by human activities including; burning and grazing, which greatly influence the soil organic matter and hence soil nitrogen content.
Effects of land use change on soil C/N ratio
The results also show that the C/N ratio had no significant differences with land use types (P > 0.01) and with elevation (P > 0.01) but the interaction between subjects effects was significant (P < 0.01) (Table 4). However, the results indicate an increase in C/N ratio with an increase in elevation in the N.W region except for soils under savanna and farmland use systems (Fig. 22). The quality of organic matter is expressed in form of the C/N ratio. According to ratings by Yerima and Van Ranst (2005a), the results show that the quality of organic matter in all the soils under the different land use systems across the different elevations ranged between good quality, medium, and low quality. At high altitude, the mean C/N ratio for soils under natural forest, savanna, and grazing land, as well as those under E. saligna plantations, reveals that the quality of organic matter was low (C/N > 14). Only soils under farmland had the medium quality of organic matter (C/N = 10–14).

Estimated marginal means of C/N ratio in the 0–15 cm soil layer across different land use/land cover systems and altitudes
At mid-altitude, the mean C/N ratio for soils under savanna forest cover reveals that the organic matter was of good quality (C/N < 10), while those for soils under afforestation plantations and grazing systems were of medium quality (C/N = 10–14). However, those under natural forest, farmland and E. saligna plantations reveal that the quality of organic matter was low (C/N > 14). At low altitude, the mean C/N ratio for soils under farmland reveals that the quality of organic matter was good (C/N < 10), while those for soils under natural forest, E. saligna plantations and grazing land were of medium quality (C/N = 10–14). However, those under natural forest cover reveals that the quality of organic matter was low (C/N > 14).
Soil C/N ratio is a sensitive indicator of soil quality. The soil C/N ratio is usually considered as an indicator of soil nitrogen mineralization ability. High C/N ratios in soils can retard the rate of organic matter and organic nitrogen decomposition by limiting the ability of soil microbial actions, whereas low C/N ratios in soils could accelerate the process of microbial decomposition of organic matter and nitrogen. However, Wu et al. (2001) reported that low soil C/N ratio is not conducive to carbon sequestration. Therefore, it can be concluded that soils under natural forest, grazing land, and E. saligna plantations slow down the decomposition rate of organic matter and organic nitrogen by limiting the soil microbial activity ability and can best sequester carbon in the region as a means to combat climate change.
Effects of land use change on soil available phosphorus
Though not significant, the soil available phosphorus also exhibited obvious differences at the surface (0–15 cm) layer under different land use/land cover systems (Table 4). However, the results indicate that concentrations of soil available phosphorus varied significantly (P < 0.01) with elevation, indicating a decrease with a decrease in elevation in the N.W region (Fig. 23) although the interaction effect between subjects was not significant (P > 0.01).

Estimated marginal means of available phosphorus (ppm) in the 0–15 cm soil layer across different land use/land cover systems and altitudes
The study showed that at high altitude, the soils under farmland use systems had the highest mean soil available phosphorus concentrations (20.1 ppm) followed by those under savanna and grazing land use system (19.1 ppm), while those under E. saligna plantation land use had the lowest value (13.4 ppm) (Table 4). This can be due to the fact that farmers applied fertilizers such as Diammonium phosphate (DAP) on their farmlands. However, at this altitude, mean soil available phosphorus concentrations at the surface (0–15 cm) layer showed no significant difference (P > 0.01) between the soils under all the land use/land cover systems. These results are consistent with the findings of Awdenegest et al. (2013).
At mid-altitude, the soils under natural savanna, and those under farmland had the highest mean soil available phosphorus concentrations (15.6 and 15.5 ppm, respectively), while those under natural forest and E. saligna plantation land cover systems were intermediate (14.6 and 11.1 ppm, respectively). Those under afforestation and grazing land use had the lowest values (9.83 and 9.33 ppm, respectively). It can be concluded here that residue ash may have enhanced the P concentrations under natural savanna, and those under farmland because burning was a cultural phenomenon under these land use systems in the area. Also, the application of chemical P-fertilizers and organic manure (poultry manure and cow dung) may have enhanced the P concentrations in selected farmlands in this area. At this altitude, mean soil available phosphorus concentrations at the surface (0–15 cm) layer showed no significant difference (P > 0.01) between the soils under all the land use/land cover systems.
At low altitude, the soils under natural savanna, and those under farmland had the highest mean soil available phosphorus concentrations (15.6 and 15.5 ppm, respectively), while those under natural forest land cover were intermediate (14.6 ppm), while those under savanna land use had the lowest values (5.30 ppm). At this altitude, mean soil available phosphorus concentrations at the surface (0–15 cm) layer showed no significant difference (P > 0.01) between the soils under all the LULC systems. It is suggested that the relatively lower available phosphorus concentrations in the protected forest and E. saligna plantations at all elevations may be related to phosphorus fixation due to the relatively higher organic matter concentrations under these land use systems. This result agrees with the findings of Yimer et al. (2008) who reported higher concentrations of P in soils of the native forest than those of cropland and grazing in the Bale Mountains of Ethiopia.
According to ratings by Yerima and Van Ranst (2005a), available phosphorus across all land uses was very low, except those in the top 0–15 cm soil layer of farmlands, at high altitude which was low. In addition, the available phosphorus in soils under all the land uses in the study area falls below the medium sufficiency range of 26–54 mg/kg suggested by Carrow et al. (2004). The available phosphorus deficiency in soils of our study area may be due to the inherent low-P status of the parent material and erosion loss. This may also be due to the low soil pH which causes P-fixation. These results confirm the findings of Yerima and Van Ranst (2005b) who reported that the available phosphorus in most soils of the North West region is low due to P-fixation, crop harvest, and erosion by water.
Effects of land use change on cation exchange capacity (CEC, cmol (+)/kg soil)
CEC also exhibited some differences at the surface (0–15 cm) layer under different land use/land cover systems, although not significant. Also, there were no significant differences (P > 0.01) with elevations and the interaction between subjects effects was not significant (P < 0.01) (Table 4). Generally, the results did not show a clear picture of the variation of CEC of soils under different land use/land cover systems with elevation, in the N.W region (Fig. 24).

Estimated marginal means of cation exchange capacity in the 0–15 cm soil layer across different land use/land cover systems and altitudes
The study shows that at high altitude, both the soils under savanna and grazing land use systems had the highest mean concentration of CEC (23.1 cmol (+)/kg soil), followed by those under farmland (19.7 cmol (+)/kg Soil), while those under E. saligna plantation and natural forest cover were relatively lower (17.6 and 16.3 cmol (+)/kg soil, respectively) (Table 4). However, at this altitude, mean CEC concentration of soils at the surface (0–15 cm) layer showed no significant difference (P > 0.01) between the soils under all the land use/land cover systems. These results contradict the findings of Awdenegest et al. (2013) who reported that the CEC concentration was low in oxisols under savanna and grazing land use systems compared to farmland use systems in Southern Ethiopia.
At mid-altitude, the soils under natural forest land cover systems had the highest mean concentration of CEC (25.8 cmol (+)/kg soil) followed by those under E. saligna plantations (24.7 cmol (+)/kg soil), while those under afforestation in the park had the lowest values (19.7 cmol (+)/kg soil). Also, at this altitude, mean concentration of CEC of soils at the surface (0–15 cm) layer showed no significant difference (P > 0.01) between the soils under all the land use/land cover systems.
At low altitude, the soils under savanna land cover systems had the highest mean CEC concentration (34.1 cmol (+)/kg soil) followed by those under natural forest (24.0 cmol (+)/kg soil) while those under farming land use systems had the lowest values (17.7 cmol (+)/kg soil). At this altitude, mean CEC concentration of soils at the surface (0–15 cm) layer showed a significant difference (P < 0.01) only between the soils under natural savanna vegetation cover and farmland use systems. Generally, according to ratings by Landon (1991), the CEC values in soils under all the land use/land cover systems, were medium except those under natural forest and savanna land use cover at mid and low elevations, respectively which were high.
Effects of land use change on electrical conductivity (mS/cm)
EC values ranged from 0.05 mS/cm under grazing land use systems to 0.18 mS/cm under natural forest vegetation. Generally, the results show that EC varied significantly (P > 0.01) with land use, but showed no significant difference in elevation (Table 6). Also, the interaction effects between subjects were not significant. At all elevations, mean EC values at the surface (0–15 cm) layer showed significant differences (P < 0.01) between the soils under natural forest and those of the other land use/land cover systems (Fig. 10). More so, although the EC content in soils under farmland were not significantly different (P > 0.01) from those for soils under the other land use systems (except those under natural forest vegetation) at all elevations (high, mid and low), the soils under natural forest had higher EC values (0.18, 0.17 and 0.12 mS/cm, respectively) than those of the other land use/land cover systems (Fig. 25). Therefore, the conversion of forest to cultivated land decreases EC in the study area. These results are in line with the findings of Kizilkaya and Dengiz (2010) who reported that changing forest to cultivated land increased EC values in their area of study due to high application rates of chemical fertilizers.

Estimated marginal means of electrical conductivity in the 0–15 cm soil layer across different land use/land cover systems and altitudes
Although EC represents soil soluble salt components, it is believed that the use of basic chemical fertilizer such as ammonium phosphate and urea under farmlands in our study area did not lead to higher EC values above normal (EC > 0.15 mS/cm will affect plant growth and development) when compared to those under natural forest covers. Therefore, farmers must avoid complete reliance on chemical inputs but continue to rely more on organic fertigation to keep EC < 0.15 in soils. In this regards, the soils under natural forest at high and mid-altitudes in this study may affect the growth and development of only some EC sensitive plants species since their EC concentrations are slightly above normal.
Effects of land use change on exchangeable bases
Exchangeable sodium (Na + ) (cmol (+)/kg soil)
Generally, the results show that mean soil exchangeable Na+ had no significant differences with land use types (P > 0.01) and across all elevations (Table 6). The concentration of exchangeable Na+ was the smallest component on the exchange complex. In addition, the interaction between subject effects was not significant (P > 0.01). Although there was no significant differences (P < 0.01) at the surface (0–15 cm) layer, at high altitude, soils under the protected forest had the highest mean soil exchangeable Na+ concentrations (1.05 cmol (+)/kg soil) followed by the soils under farmlands (1.01 cmol (+)/kg soil), while those under savanna and grazing land use systems had lower values (0.65 and 0.67, respectively) (Fig. 26).

Estimated marginal means of exchangeable Na+ in the 0–15 cm soil layer across different land use/land cover systems and altitudes
This result corroborate the findings of Yimer et al. (2008) who reported that the concentration of soil exchangeable Na+ was lower in cropland than in the grazing and native forest. Alem et al. (2010) also observed higher soil exchangeable Na+ concentration in soils under E. grandis when compared to those of native forest in Ethiopia. Significantly high concentrations of exchangeable Na+ in the soil in, particularly in proportion to the other cations present, can have an adverse effect on crops and physical conditions of the soil (Yerima and Van Ranst 2005a; Bashour and Sayegh 2007). Although Adetunji (1996) indicated that soils with exchangeable Na+ of 1 cmol (+)/kg soil should be regarded as potentially sodic, those under native forest in the study cannot be regarded as sodic soils, since the soil pH was slightly acidic, and there were no existing evidence of soluble salts in the area. In fact, the concentration of exchangeable Na+ in the other land use systems did not attain 1 cmol (+)/kg soil. The alternate wet and dry seasons and the topographic (drainage) conditions may be responsible for the potential sodicity value recorded under the protected forest systems in this study.
At mid-altitude, soils under the grazing land use had the highest mean soil exchangeable Na+ concentrations (0.88 cmol (+)/kg soil) followed by the soils under E. saligna plantations (0.86 cmol (+)/kg soil), while those under protected forest and savanna land cover systems had the lowest concentrations (0.65 cmol (+)/kg soil). However, at this altitude, mean soil exchangeable Na+ concentrations at the surface (0–15 cm) layer showed no significant difference (P > 0.01) between the soils under all the land use/land cover systems. At low altitude, soils under the natural forest land use system had the highest mean soil exchangeable Na+ concentrations (0.85 cmol (+)/kg soil) while those under E. saligna plantation had the lowest concentration (0.58 cmol (+)/kg soil). This may be due to the fact that the low soil pH under the Eucalyptus plantation would lead to a decrease in soil base saturation, through immobilization of the exchangeable bases, and may result in soil exchangeable bases depletion over time (Aweto and Moleele 2005).
Exchangeable potassium (K + , cmol (+)/kg soil)
The results showed that soil exchangeable K+ did not significantly vary with land use types (P > 0.01) but varied significantly with elevation (P < 0.01) (Table 6). However, the interaction between subject effects was significant (P > 0.01). At high altitude, soils under the protected forest had the highest available potassium concentration (4.00 cmol (+)/kg soil) followed by the soils under farmlands (2.94 cmol (+)/kg soil), while those under savanna and grazing land use had the lowest concentrations (1.05 cmol (+)/kg soil) (Fig. 27). At this altitude, mean soil available potassium at the surface (0–15 cm) layer showed significant differences (P < 0.01) between the soils under natural forest and all the other land use systems except farmland. At mid-altitude, soils under the protected natural forest also had the highest mean soil exchangeable K+ concentration (1.75 cmol (+)/kg soil) followed by the soils under farmlands (1.05 cmol (+)/kg soil), while those under savanna and grazing land use had the lowest concentration (0.25 cmol (+)/kg soil). However, at this altitude, mean soil exchangeable K+ concentration at the surface (0–15 cm) layer showed no significant difference (P > 0.01) between the soils under all the land use/land cover systems.

Estimated marginal means of exchangeable K+ in the 0–15 cm soil layer across different land use/land cover systems and altitudes
At low altitude, soils under the savanna land use system also had the highest mean exchangeable K+ concentration (3.10 cmol (+)/kg soil) followed by the soils under farmlands (2.49 cmol (+)/kg soil) while those under natural forest cover and grazing land use had the lowest concentrations (1.90 and 1.83 cmol (+)/kg soil, respectively). At this altitude, mean soil exchangeable K+ concentration at the surface (0–15 cm) layer showed no significant difference (P > 0.01) between the soils under all the land use/land cover systems. The observed high concentrations of soil exchangeable K+ under the natural forest land use system can be attributed to a relative pumping of potassium from the subsoil to topsoil by vegetation (Bohn et al. 2001). Also, the observed high concentration of soil exchangeable K+ under the cultivation land use system can be attributed to the observed frequent application of household wastes, particularly wood ash, as well as burning of farm residues. These results are consistent with the findings of Bohn et al. (2001). According to ratings by Landon (1991), soil exchangeable K+ concentration under the natural forest land use system and those under all the other land use systems was high across the different elevations except those in grazing land at mid-altitude which was medium. The medium soil exchangeable K+ concentrations under grazing land could be associated with soil degradation and losses due to leaching as the grazing land was denuded of vegetation cover. A critical concentration of 0.12 cmol/kg soil is required for plant growth on oxisols (Yerima and Van Ranst 2005b) and the results indicate that exchangeable K+ concentration is not limiting in the soils of the study area.
Exchangeable calcium (Ca 2+ , cmol (+)/kg soil)
The results showed that soil exchangeable Ca2+ concentrations did not significantly vary with land use type (P > 0.01) but varied significantly with elevation (P < 0.01) (Table 6). However, the interaction between subject effects was significant (P < 0.01). At high altitude, soils under the protected forest had the highest mean exchangeable Ca2+ concentration (8.25 cmol (+)/kg soil) followed by the soils under farmlands (6.00 cmol (+)/kg soil), while those under savanna and grazing land use had the lowest (2.00 cmol (+)/kg soil) (Fig. 28). At this altitude, mean soil exchangeable Ca2+ at the surface (0–15 cm) layer showed significant differences (P < 0.01) between the soils under natural forest and all the other land use systems except those under farmland.

Estimated marginal means of exchangeable Ca2+ in the 0–15 cm soil layer across different land use/land cover systems and altitudes
At mid-altitude, soils under the protected natural forest also had the highest mean soil exchangeable Ca2+ concentrations (3.68 cmol (+)/kg soil) followed by the soils under E. saligna plantation (2.20 cmol (+)/kg soil), while those under savanna land cover had the lowest concentration (0.80 cmol (+)/kg soil). However, at this altitude, mean soil exchangeable Ca2+ concentrations at the surface (0–15 cm) layer showed no significant difference (P > 0.01) between the soils under all the land use/land cover systems. At low altitude, soils under the natural savanna land use systems had the highest mean exchangeable Ca2+ concentration (8.50 cmol (+)/kg soil), followed by the soils under E. saligna plantation (4.98 cmol (+)/kg soil), while those under natural forest cover had the lowest concentration (2.85 cmol (+)/kg soil). At this altitude, mean soil exchangeable Ca2+ at the surface (0–15 cm) layer showed significant differences (P < 0.01) between the soils under natural forest, savanna, and farmland.
According to ratings by Landon (1991), soil exchangeable Ca2+ concentrations in the protected forest and farmland as well as those under savanna and grazing land and E. saligna plantation in the high and low altitudes respectively, was medium, while the soil exchangeable Ca2+ concentrations under all the other land use systems across the different altitudes was low. The medium soil exchangeable Ca2+ in the protected forest, farmland, grazing land and E. saligna plantation was probably due to the application of household wastes (wood ash in particular) in the fields as well as the burning of floral and crop residues since ash is a good source of Ca2+, K+, P, and Mg2+ (Voundi et al. 1998) and pumping of bases from the subsoil by the vegetation and returning them into the topsoil (Yimer et al. 2008). On the other hand, the low soil exchangeable Ca2+ could be as a result of soil erosion and nutrient losses through leaching as the grazing land was denuded of vegetation cover. A critical concentration of 0.2 cmol/kg soil is required for plant growth in tropical soils (Landon 1991) and the results indicate that exchangeable Ca2+ is not limiting in the soil of study area.
Exchangeable magnesium (Mg 2+ , cmol (+)/kg soil)
The results also showed that the concentrations of soil exchangeable Mg2+ did not vary significantly with land use type (P > 0.01) but significantly differed with altitude (P < 0.01) (Table 6) with the lowest concentrations at mid-altitude (Table 7). More so, the interaction between subject effects was not significant (P > 0.01). At high altitude, soils under protected forest had the highest mean exchangeable Mg2+ concentrations (3.35 cmol (+)/kg soil) followed by the soils under farmlands (2.69 cmol (+)/kg soil), while those under savanna and grazing land use had the lowest concentrations (0.93 cmol (+)/kg soil) (Fig. 29). At this altitude, mean soil exchangeable Mg2+ concentration at the surface (0–15 cm) layer showed significant differences (P < 0.01) between the soils under natural forest and all the other land use systems, except those under farmland.

Estimated marginal means of exchangeable Mg2+ in the 0–15 cm soil layer across different land use/land cover systems and altitudes
At mid-altitude, soils under the protected natural forest also had the highest soil mean exchangeable Mg2+ concentrations (1.60 cmol (+)/kg soil) followed by the soils under farmland (0.98 cmol (+)/kg soil), while those under savanna land cover had the lowest concentrations (0.25 cmol (+)/kg soil). More so, at this altitude, mean soil exchangeable Mg2+ concentrations at the surface (0–15 cm) layer showed no significant difference (P > 0.01) between the soils under all the land use/land cover systems. At low altitude, soils under the natural savanna land use system had the highest mean exchangeable Mg2+ concentration (2.90 cmol (+)/kg soil) followed by the soils under farmland (2.36 cmol (+)/kg soil), while those under natural forest cover had the lowest concentration (2.85 cmol (+)/kg soil). At this altitude, mean soil exchangeable Mg2+ at the surface (0–15 cm) layer showed no significant differences (P < 0.01) between the soils under all the land use/land cover systems.
Generally, the results for exchangeable bases follow a similar trend and hence the simultaneous explanation provided above is believed to provide justifications for these dynamics. According to ratings by Landon (1991), soil exchangeable Mg2+ concentration in all the land use/land cover systems was medium, except for those under savanna and afforestation in the mid-altitude, which was less than the critical level of 0.5 cmol (+)/kg soil. A concentration less than the critical level would require an application of magnesium limestone for management accordingly (Awdenegest et al. 2013).
Effects of LULC change on soil exchangeable acidity (H+ + Al3+)
The laboratory results showed that some soils under natural forest cover, farmland and E. saligna plantations, particularly at high and mid-altitudes, had relatively lower pH values (pH < 5.5), though only mean pH concentrations of soils under farmland are indicated in Table 4. These soils were selected and analysed for exchangeable acidity (EA) and the results are presented in Table 8.
It has been well reported that high exchangeable acidity occurs in very acidic soils, with low pH values (Yerima and Van Ranst 2005a; Aweto and Moleele 2005). The hydrolysis of Al3+ ions that constitute part of the clay layers become exchangeable and contribute to the development of soil acidity (Yerima and Van Ranst 2005a; Oyedele et al. (2009). In fact, correlation analysis (Table 9) shows a significantly strong negative relationship (r = − 0.752, P < 0.01) between soil pH and soil exchangeable acidity. Frimpong et al. (2014) stated that at pH below 5.5, aluminum and manganese toxicities might occur.
At high altitude, soils under farmland and Eucalyptus plantations had high EA values (Ex. Acidity > 2), while at mid-altitude, only those under farmland had a high EA value (Table 8). These results indicate that at high altitudes, soils under farmland and Eucalyptus plantations as well as those under farmland at mid-altitude, present a high potential for aluminum toxicity to plants and may have immobilized soil essential nutrients. Aweto and Moleele (2005) reported that soils with higher exchangeable acidity cause immobilization of soil essential nutrients including; P, N, Ca, Mg, and K under Eucalyptus spp. The observed high values of EA indicates a difficulty to manage the acidity problems, while the observed moderate and lower EA values indicates the easiness to also manage the acidity problem of the respective land uses and elevations, within the study area.
According to the Apal Agricultural Laboratory; soil test interpretation guide (2016), where extractable aluminum is > 2, sensitive plants will be affected. It also states that excess soluble/available aluminum (Al3+) is toxic to plants and can cause a number of problems. The guide further explains that some issue caused by Al3+ toxicity can include: direct toxicity, primarily seen as stunted roots; reduction of the availability of phosphorus, through the formation of Al-P compounds; reduction of the availability of sulfur, through the formation of Al-S compounds; reduction of the availability of other cations (Ca2+ and Mg2+) through competitive interactions; and reduced rhizobium levels on legumes. The high EA under eucalyptus plantations confirms the low yields observed for most crops planted around eucalyptus plantations and confirms the acidifying nature of eucalyptus leaves under decomposition. The high EA values in farmland are consistent with the acidification resulting from the application of ammonium fertilizers (Yerima and Van Ranst 2005a, b).
Conclusions
This study was aimed at assessing the effects of six land use systems on fifteen soil physicochemical properties in the North West region of Cameroon. Ninety soil samples were collected from each land use system at the 0–15 cm depth for laboratory analysis. The findings suggest that LULC change has influenced many soil physicochemical properties at different topographic altitudes in the North West region of Cameroon. The conversion of natural forest or savanna to farmland reduced the silt contents, moisture content, organic matter, soil organic carbon, total nitrogen, available phosphorus, pH, cation exchange capacity, and exchangeable bases, but increased the soil bulk density, electrical conductivity, exchangeable acidity and sand content significantly (P < 0.05). The results revealed that deforestation and subsequent cultivation of soil had negative effects on the measured soil properties. Therefore, it can be concluded that the conversion of natural forest or pasture land to cultivation land subjected soil physicochemical properties to degradation thereby sullying soil quality. To reverse soil degradation and promote restoration in the region, emphases should be placed on promoting site-specific, sustainable land management practices within the savanna, grazing, agricultural and forest management systems.
The scope of this research was limited to only three subdivisions (Santa, Bamenda, and Ndop) under just two divisions (Mezam and Ngoketungia) but gives a representation of the geomorphic surfaces in the NW region of Cameroon. The research also used only selected soil physical and chemical properties as indicators of soil quality under the influence of land use change. Generally, soil quality varies greatly with soil type, depth and over a long timescale, but this research was based on assessing the state of soil quality under different land uses at soil surface (0–15 cm) level.
Change history
31 May 2018
After publication of our article (Tellen and Yerima 2018) it came to our attention that we did not acknowledge that some sections of text and one figure (Fig. 11b) overlap with the Master’s Thesis of Albert Mensah, “Effects of Eucalyptus plantation on soil physico-chemical properties in Thiririka sub-catchment, Kiambu County, Kenya”, which was defended at the School of Pure and Applied Sciences, Kenyatta University, in February 2016.
Abbreviations
- Av.P:
-
available phosphorous
- BD:
-
bulk density
- C/N:
-
the ratio of carbon to nitrogen
- CEC:
-
cation exchange capacity
- EA:
-
exchangeable acidity
- EB:
-
exchangeable bases
- EC:
-
electrical conductivity
- KCl:
-
potassium chloride
- ANOVA:
-
analysis of variance ratio
- LULC:
-
land use/land cover systems
- MC:
-
moisture content
- NW:
-
North West
- OC:
-
organic carbon
- SOC:
-
soil organic carbon
- SOM:
-
soil organic matter
- SPSS:
-
Statistical package for social science
- TN:
-
total nitrogen
References
Adetunji MT (1996) Field soil tests for NO3, NH4, PO4, K, Ca and Na. Department of Soil Science and Mechanization, University of Abeokuta, Nigeria. In: Simple Soil, Water and Plant Testing Techniques for Soil Resource Management. Proceedings of a Training Course Held in Ibadan, Nigeria, 16–27 September 1996. International Institute of Tropical Agriculture. FAO, Rome
Alem S, Woldemariam T, Pavlis J (2010) Evaluation of soil nutrients under Eucalyptus grandis plantation and adjacent sub-montane rain forest. J For Res 21(4):457–460
Apal Agricultural Laboratory (2016) Soil test interpretation guide. http://www.apal.com.au/. Accessed 22 June 2016
Awdenegest M, Melku D, Fantaw Y (2013) Land use effects on soil quality indicators: a case study of Abo-Wonsho Southern Ethiopia. Appl Environ Soil Sci 2013:9 (Article ID 784989)
Aweto AO, Moleele NM (2005) Impact of Eucalyptus camaldulensis plantation on an alluvial soil in south eastern Botswana. Int J Environ Stud 62(2):163–170
Ayele T, Beyene S, Esayas A (2013) Changes in land use on soil physicochemical properties: the case of smallholders fruit-based land use systems in Arba Minch, southern Ethiopia. Int J Curr Res 5(10):3203–3210
Bashour II, Sayegh AH (2007) Methods of analysis for soils of arid and semi-arid regions. FAO, Rome, pp 1–128
Bohn HL, McNeal BL, O’Connor GA (2001) Soil chemistry, 3rd edn. Wiley, New York, p 322
Brejda JJ, Karlen DL, Smith JL, Allan DL (2000a) Identification of regional soil quality factors and indicators. II. Northern Mississippi loess hills and palouse prairie. Soil Sci Soc Am J 64:2125–2135
Brejda JJ, Moorman TB, Karlen DL, Dao TH (2000b) Identification of regional soil quality factors and indicators: I. Central and southern high plains. Soil Sci Soc Am J 64:2115–2124
Cao Y, Fu S, Zou X, Cao H, Shao Y, Zhou L (2010) Soil microbial community composition under Eucalyptus plantations of different age in subtropical China. Eur J Soil Biol 46(2):128–135
Carrow RN, Stowell L, Gelernter W, Davis S, Duncan RR, Skorulski J (2004) Clarifying soil testing: III. SLAN sufficiency ranges and recommendations. Golf Course Manag 72:194–198
Cheek M, Onana JM, Pollard BJ (2000) The plants of Mount Oku and the Ijim Ridge, Cameroon: a conservation checklist. RBG, Kew, p 211
Epule T, Peng C, Lepage L, Chen Z (2011) Forest loss triggers in Cameroon: a quantitative assessment using multiple linear regression approach. J Geograp Geol 3(1):30–40. https://doi.org/10.5539/jgg.v3n1p30
FAO (2009) State of the World’s Forests. Rome, Italy. pp 3–5. http://www.fao.org/docrep/011/i0350e/i0350e00.htm
FAO (2017) Action against desertification. Background information available at: http://www.fao.org/in-action/action-against-desertification/background/en/. Retrieved May 2017.
Food and Agricultural Organization of the United Nations (2010a) FAOSTAT. http://faostat.org. Accessed Apr 2013
Food and Agricultural Organization of the United Nations (2010b) Forest Resource Assessment. FAO Forestry paper no. 163. FAO, Rome, http://www.fao.org. Accessed Feb 2013
Frimpong KA, Afrifa EKA, Ampofo EA, Kwakye PK (2014) Plant litter turnover, soil chemical and physical properties in a Ghanaian gold-mined soil revegetated with Acacia species. Int J Environ Sci 4(5):987
Getachew F, Abdulkadir A, Lemenih M, Fetene A (2012) Effects of different land uses on soil physical and chemical properties in Wondo Genet area, Ethiopia. N Y Sci J 5:110–118
Guo LB, Gifford RM (2002) Soil carbon stocks and land use change. Glob Change Biol 8:345–360
Harvey Y, Pollard BJ, Darbyshire I, Onana JM, Cheek M (2004) The plants of Bali Ngemba Forest Reserve, Cameroon. Royal Botanic Gardens, Kew, p 154
Hoogsteen MJJ, Lantinga EA, Bakker EJ, Groot JCJ, Tittonell PA (2015) Estimating soil organic carbon through loss on ignition: effects of ignition conditions and structural water loss. Eur J Soil Sci 66(2):320–328
House APN (1992) Eucalyptus: curse or cure?. Australian Center for International Agricultural Research, Canberra, p 197
Humphrey NN, Amawa SG (2014) Environmental degradation and the emergence of agricultural frontiers in the North West of Cameroon. J Sustain Dev 7(5):111–127. https://doi.org/10.5539/jsd.v7n5p111
Javad RSA, Hassan K, Esmaeil HA (2014) Assessment the effects of land use changes on soil physicochemical properties in Jafarabad of Golestan province. Iran. Bull Environ Pharmacol Life Sci 3(III):296–300
Kakaire J, Makokha GL, Mwanjalolo M, Mensah AK, Menya E (2015) Effects of mulching on soil hydro-physical properties in Kibaale Sub-catchment, South Central Uganda. Appl Ecol Environ Sci 3(5):127–135
Kizilkaya R, Dengiz O (2010) Variation of land use and land cover effects on some soil physico-chemical characteristics and soil enzyme activity. ZemdirbAgric 97(2):15–24
Kolay AK (2000) Basic concepts of soil science, 2nd edn. New Age International Publishers, New Delhi. pp 78–80, 90–91, 102–105, 138
Landon JR (1991) Booker tropical soil manual: a handbook for soil survey and agricultural land evaluation in the tropics and subtropics. Longman Scientific and Technical, New York
Leeper GW, Uren NC (1993) Soil science, an introduction, 5th edn. Melbourne University Press, Melbourne. ISBN 0-522-84464-2
Leu A (2007) Organics and soil carbon: increasing soil carbon, crop productivity and farm profitability. In: ‘Managing the Carbon Cycle’ Katanning Workshop, 21–22 March, 2007. http://www.amazingcarbon.com
Lobe I, Amelung W, Du Preez CC (2001) Losses of soil carbon and nitrogen with prolonged arable cropping from sandy soils of the South African Highveld. Eur J Soil Sci 52:939101
Manu IN, Andu WN, Tarla DN, Agharih WN (2014) Causes of cattle theft in the North West Region of Cameroon. Sch J Agric Sci 4(4):181–187
McCauley A, Jones C, Jacobsen J (2005) Basic soil properties: soil and water management module I. Montana State University Extension Service. http://landresources.montana.edu/SWM/PDF/Final_proof_SW1.pdf. Retrieved 4 Mar 2014
McNaughton SJ, Banyikwa FF, McNaughton MM (1997) Promotion of the cycling of diet-enhancing nutrients by African grazers. Science 278:1798–1800
Ogle SM, Breidt FJ, Paustiani K (2005) Agricultural management impacts on soil organic carbon storage under moist and dry climatic conditions of temperate and tropical regions. Biogeochemistry 72:87–121
Oyedele DJ, Awotoye OO, Popoola SE (2009) Soil physical and chemical properties under continuous maize cultivation as influenced by hedgerow trees species on an alfisol in South Western Nigeria. Afr J Agric Res 4(7):736–739
Pauwels JM, Van Ranst E, Verloo M, Mvondo Ze A (1992) Méthodes d’analyses de sols et de plantes, équipements, gestion de stocks de verrerie et de produits chimiques. A. G. Bulding, Bruxelles
Ravina M (2012) Impact of Eucalyptus plantations on pasture land on soil properties and carbon sequestration in Brazil. Swedish University of Agricultural Sciences, Uppsala
Roe D, Nelson F, Sandbrook C (eds) (2009) Community management of natural resources in Africa: impacts, experiences and future directions, Natural Resource Issues No. 18, International Institute for Environment and Development, London
Roose E, Barthes B (2001) Organic matter management for soil conservation and productivity restoration in Africa: a contribution from francophone research. Nutr Cycl Agroecosyst 61:159–170
Sui YY, Zhang XY, Jiao XG, Wang QC, Zhao J (2005) Effect of long-term different fertilizer applications on organic matter and nitrogen of black farm-land. J Soil Water Conserv 19:190–192
Van Reewijk LP (2002) Procedures for soil analysis. Technical paper, 5th edn. International Soil Reference and Information Center (ISRIC), Wageningen
Voundi NJC, Demeyer A, Verbo MG (1998) Chemical effects of wood ash on plant growth in tropical acid soils. Bioresour Technol 63:251–260
Walkley A, Black IA (1934) An examination of Degtjareff method for determining soil organic matter and a proposed modification of the chromic acid titration method. Soil Sci 37:29–37
Wiesmeier M, Sporlein P, Geu U, Hangen E, Haug S, Reischl A, Schilling B, von Lutzow M, Kogel-Knabner I (2012) Soil organic carbon stocks in southeast Germany Bavaria, as affected by land use, soil type and sampling depth. Glob Change Biol 18:2233–2245. https://doi.org/10.1111/j.1365-2486.2012.02699.x
Wu HB, Guo ZT, Peng CH (2001) Changes in terrestrial carbon storage with global climate changes since the last interglacial. Q Sci 21:366–376
Yerima PKB (2011) Protective measures taken for preserving species endangered of extinction due to the climate change in sub-Sahara Africa: Case of the Yongka Western Highlands Research Garden-Park, Nkwen-Bamenda, NW Region, Cameroon. In: Research and Development in sub-Saharan Africa, Support Africa International
Yerima BPK, Van Ranst E (2005a) Introduction to soil science: soils of the tropics. Trafford Publishing, Victoria, p 440
Yerima BPK, Van Ranst E (2005b) Major soil classification systems used in the tropics: soils of Cameroon. Trafford Publishing, Victoria, p 312
Yimer F, Ledin S, Abdelkadir A (2008) Concentrations of exchangeable bases and cation exchange capacity in soils of cropland, grazing and forest in the Bale Mountains Ethiopia. Forest Ecol Manag 256(6):1298–1302. https://doi.org/10.1016/j.foreco.2008.06.047
Zerga B (2015) Ecological impacts of Eucalyptus plantation in Eza Wereda, Ethiopia. Int Invent J Agric Soil Sci. 3(4):47–51. ISSN: 2408-7254. http://internationalinventjournals.org/journals/IIJAS
Authors’ contributions
VAT literature review, field survey, data collection and analysis and manuscript preparation. YBPK overall management of the field survey, technical support and reviewing the manuscript. Both authors read and approved the final manuscript.
Acknowledgements
Authors are thankful to the team of laboratory technicians in the Soil science laboratory at the University of Dschang, Cameroon for the technical support. Authors are also thankful to the anonymous reviewers for their valuable suggestions to improve the manuscript.
Competing interests
The authors declare that they have no competing interests.
Availability of data and materials
The dataset supporting the conclusions of this article is included within the article.
Consent for publication
All authors read the manuscript and agree to publication.
Declaration
I, Valentine Asong Tellen, holder of ORCID number 0000-0001-8513-788X hereby declare that this research article is written by the authors whose names have been appropriately indicated.
Ethics approval and consent to participate
The authors hereby declare that, this manuscript is not published or considered for publication elsewhere.
Funding
Self-funded.
Publisher’s Note
Springer Nature remains neutral with regard to jurisdictional claims in published maps and institutional affiliations.
Author information
Authors and Affiliations
Corresponding author
Rights and permissions
Open Access This article is distributed under the terms of the Creative Commons Attribution 4.0 International License (http://creativecommons.org/licenses/by/4.0/), which permits unrestricted use, distribution, and reproduction in any medium, provided you give appropriate credit to the original author(s) and the source, provide a link to the Creative Commons license, and indicate if changes were made.
About this article

Cite this article
Tellen, V.A., Yerima, B.P.K. Effects of land use change on soil physicochemical properties in selected areas in the North West region of Cameroon. Environ Syst Res 7, 3 (2018). https://doi.org/10.1186/s40068-018-0106-0
Received:
Accepted:
Published:
DOI: https://doi.org/10.1186/s40068-018-0106-0