- Research
- Open access
- Published:
Evaluation of the efficiency of ceramic filters for water treatment in Kambata Tabaro zone, southern Ethiopia
Environmental Systems Research volume 8, Article number: 1 (2019)
Abstract
Background
The Ceramic water filtration has been greatly improving the most waste materials from drinking water in developing countries. This research was carried out to determine the efficiency of the Ceramic water filters in improving water impurities. The raw materials were grind, sieved with 0.5 mm opening mush size, mixed with water, molded in flower pot shape and fired at 700 °C, 750 °C and 800 °C.
Results
The average removing efficiency of the ceramic filters was found to be 59.6%, 86.3%, 87.6%, 56.9%, 59.02%, 88.98%,76.2%, 52.88%, 46.23% and 226.66 m L/h for turbidity, total coliform, E. coli, calcium, magnesium, sulphate, phosphate, iron, nitrite and flow rate, respectively in the analysis. Most of the ceramic filters were removed microbial from the contaminated river water effectively compared to the World Health Organization standard. The results showed that increasing the burn-out material during production of the filter elements increase the porosity and flow rate while decrease the removal efficiency of turbidity, microorganisms and water hardness agent from the source water. It was observed that there was a significance difference in removing total coliform, E. coli and flow rate between ceramic filters with different percentage composition of clay to sawdust. The change in percentage composition of clay to sawdust and firing temperature did not show significance difference in removing actions of iron, nitrite, sulphate, phosphate, magnesium and calcium.
Conclusion
Based on the result, it is possible to conclude that the ceramic water filtrate that prepared from 80, 25 and 5% clay, sawdust and grog at firing temperature of 750 °C and 800 °C with lower porosity of the ceramic filter elements were found to be have the best removal efficiency.
Introduction
Ceramic water filtration has been greatly improving the most waste materials from drinking water in developing countries. In the World, 1.1 billion peoples do not have access to improved drinking-water sources and many people are suffering from diarrhoeal disease (Sobsey et al. 2008). The community faces a tough challenge to have the number people without access to improved water supply. Lack of access to drinking water and exposure to waterborne diseases from unsafe drinking water are problems by many people in the developing countries like Ethiopia (WHO 2012).
Access to safe drinking water is essential to a person’s for health protection. Recent meta-analysis of field trials has suggested that household-based water quality treatment and safe storage with reducing diarrheal disease (Clasen and Boisson 2006; Clasen et al. 2007). In this context many organizations have initiate the development of drinking water treatment systems suitable for the tropical conditions in developing countries (WHO 2012).
Ceramic silver pot filters (CSF) which made from local available materials are safe to treat drinking water. These filters are low-cost and eliminate approximately 99.88% of water born disease agents for rural point-of-use water treatment (Eneyew and Tesfaye 2017). They can be obtained easily and by low cost from local manufacturers. In addition, the filters are effective purifying water made a pot-shape device which removes dangerous microorganisms present in untreated water through the use of gravity filtration.
Ceramic flower pot also known as the filter elements used a mixture of clay powder and burn out material are paint with a special solution of silver that kills bacteria. Decontamination can work by pore capture and silver disinfection. When contaminate water is pour the tiny pores inside the ceramic pot act as a filter that traps most particles and debris along with larger parasites and bacteria (Elmore et al. 2005). Silver nitrate has the effect of essentially killing and disabling the reproduction of the smallest bacteria that are able to pass through the pores. The silver also helps to prevent mold from growing on the filter surface with time and continued use the pores of the filter diminish in size due to clogging and become more efficient in retaining particulates from the water this pot is typically place inside a plastic bucket with a cover lid to help prevent contamination (Howe et al. 2006).
There is different household water treatment techniques used in the world such as boiling, chlorination and bio-sand filtration. All these water treatment techniques are used to remove the waterborne disease causing microorganisms and to reduce turbidity of the source water. Those techniques are expensive and also reduce the quality of water for example using chlorination as a household water treatment reduce or change the taste of water. Chlorine in water combines with natural organic compounds to yield substances such as trihalo methane. The haloacetic acids and chlorophenols activities to human health (Yang and Shang 2004).
The evaluation of the pre-treatment conditions and fouling behavior of ceramic filter process is prerequisite for the implementation for water treatment for drinking water production options is adsorption powder activate. Ceramic water filters are reducing the burden of water borne illnesses an affordable cost (Huang et al. 2008). However, there is the scarcity of study on the evaluation of ceramic filters capacity to remove water impurities generally in southern Ethiopia and particularly in the study area.
Materials and methods
Description of the study area
This study was conducted in Kambata Tambaro zone, in Hadaro and TuntoWoredas, three selected kebeles, namely Ajora, Tunto and Lalo. Kambata Tabaro zone that found approximately 247 km south-west of Addis Ababa, capital city of Ethiopia. The whole Kambata Tambaro zone is found between 500 and 3500 meters above sea level and its topography is characterized by steep slope at the foot of Anbericho, Dato and Ketta Mountains. The zone is boarded on the south by Wolaita, on the southwest by Dawro, on the northwest by Hadiya, on the north by Gurage zones and on the east by Halaba special woredas.
Sample collection and preparation
Clay soils were collected from Ajora, Tunto and Lalo sits. The collected clay soils were packed, labelled and transported to the drying place. The clay soils were combined with equal proportion and dry in the sun for 7 days with guidance of the local potters. The clay was grounded with wooden mortar and pestle and screened with 0.5 mm sieve size. The saw dust was collected from local furniture manufacturers. After drying for 7 days it was processed through wooden mortar and pestle like clay. The saw dust was screened with 0.5 mm opening sieve. Grog was grounded with mortar, pestle and sieved using 0.5 mm sieve size.
Mixing the raw materials
The burned material (sawdust) and grog were mixed for 40 min in dry condition with different proportion. Water was added uniformly on a dry mixture of clay, saw dust and grog and mixed by wedging and rolling for 40 min to get a smooth homogeneous mixture. Finally, it was divided into blocks as shown in the Table 1 (Kabagambe 2010). Ceramic filters were designed in shape of a flower pot, disc, and candle.
Forming filter elements and firing
Clay mixtures were moulded into flower pot shape in a plastic cup. The pots were pressed to the wall of about more than 1 cm thickness. The press filter materials were dried in open air for 3 days and on a drying place for 10 days to remove excess moisture which can cause the filter to crack during the firing process (Babafemi and Yinusa 2015).
Firing was used to produce dense materials and components from ceramic powders by applying thermal energy. After the block clay mixtures were moulded into flowerpot shapes in the desire size, the sun dry filter pots were fired in the furnace at different temperature. Different batch of press dry ceramic filters are place in a muffle furnace and sinter for 5 h at 700 °C, 750 °C and 800 °C with 10 °C heating and cooling rates for 5 h. Filter code 1, 4 and 7 were fired at 700 °C, filter code 2, 5 and 8 were fired at 750 °C and filter code 3, 6 and 9 were fired at temperature of 800 °C (Table 1) (Joong and Kang 2005).
Ceramic filters test for water treatments
Contaminated river water samples were collected from Hadaro Sana River by using standard sampling techniques according to Ilkeret al. (2016). Grab samples of the source water were collected with cleaned sterile plastic container and filled in large plastic container, then, transported to laboratory and refrigerated.
Flow rate test
Flow rate was measured with water taken from the same source Sana River. Source water was filled continuously in the filter elements on testing day and other water quality parameters were tested in the same day. The filter elements made in the above procedure were soaked in pure distilled water at least for 8 h for effective and constant flow rate determination in measuring the flow rate of filter elements. It was tested by measuring the amount of water that was percolated after 1 h. The water that pass through the filter flowerpots were collected in polyethylene plastic cup then the time and discharged water were recorded on the filter log (Martins 2011). The average flow rates were monitored throughout production. The filter elements were cleaned immediately after testing with distilled water.
Microbial removal test
Sana river water was contaminated with indicator microorganisms. This water was diluted with sterilize water at 110 °C in 1:1000 ratio by taking 1 mL of the river water and diluted with 999 mL sterilize water. The common indicator microorganisms used were E. coli and total coliform. A membrane filtration technique was used to detect and enumerate total coliform and E. coli from both source water and filtered water samples. The membrane in membrane filtration has uniformly sized holes or pores of diameter 0.45 μm. This pore size is slightly smaller than the diameter of typic, meal total coliform or other bacteria of interest. As the water sample was drawn through the filter, pure water passed through the pores, but the total coliform, E. coli and anything larger in size than 0.45 μm were caught on the surface or trapped in the pores of the membrane. The filters were tested for the removal efficiency of microbiological indicators (total coliform and E. coli).
Filter paper with 0.45 μm pore size was placed on the filter support base by using sterile tweezers. The whole apparatus was moved in a swirling motion to stir the sample by pouring 100 ml of the diluted river water. Filtration was sprinted and the funnel was rinsed with about 30 ml of distilled water twice. The filter membrane was removed carefully with sterilized tweezers and the membrane was then transferred to Membrane Lauryl Sulphate Broth media on metal Petri dish for in a rolling motion. The Petri dishes were inverted and placed into incubator set at 32 °C and 40 °C for 16 h for growth of colony of total coliform and E. coli.
The number of coliform forming units (CFU) were counted under magnifying glass and were expressed as CFU/100 ml. Microbial removal efficiency were calculated in terms of percent removal efficiency by the following formula.
where C influent microbial concentration in the raw water sample (cfu/100 mL) effluent: microbial concentration in the filtered water sample (cfu/100 mL).
Turbidity reduction test
Turbidity of the water in the influent and effluent water samples were tested by using portable turbidity mete (CL52 D NEPHELOMETER). Turbidity removal efficiency of the ceramic filters was evaluated by using the same river water. Turbidity of the water samples was measured relative to the turbidity of distilled water having turbidity 2NTU. A small volume of 15 ml of the sample was placed in the sample cell bottle. The exterior surface of the bottle was wiped clean of fingerprints with the provided cleaning cloth before placing in the turbidity meter. First, the turbidity of source water was tested for turbidity before being filtration. Then the source water was passed through different filters. The effluent water turbidity was tested after passing through the developed filters.
Finally, the turbidity reduction was calculated by the following formula.
Water hardness agents removal test
Water hardness removal efficiency of the ceramic filter elements were evaluated with complexation titration method by using EDTA and eriochrome black T (EBT) as an indicator. The concentration of calcium and magnesium cations that cause for the hardness of water were measured using complexometry titration in the laboratory prepared solution. 0.0227 M magnesium solution was prepared by dissolving weighted 4.6 g MgCl2·6H2O in 500 mL conical flask with distilled water and transferred to 1000 mL volumetric flask and filled with distilled water up to the mark. Calcium chloride solution was prepared from 1.1 g of solid CaCl2 dissolving in a beaker of 500 mL with distilled water then transferred to 1000 mL volumetric flask and filled with distilled water up to the mark.
The titrant 0.01 M EDTA solution was prepared by weighing 3.72 g of EDTA sodium salt dried at 80 °C and dissolved in 500 mL beaker then transferred to 1000 mL volumetric flask and filled up to mark. EDTA solution was standardised with prepared primary standard solution of CaCO3. An approximately 0.01 M solution of EDTA was prepared by dissolving 3.7224 g EDTA in distilled water and diluted to 1 L and the solution was standardized with standard calcium carbonate solution complexometrically. EBT solution was prepared by dissolving 0.2 g of EBT indicator in 15 mL ammonia solution and 5 mL absolute ethanol. Buffer solution of pH = 10 was prepared by adding weighed 17 g of NH4Cl in 142 mL concentrated ammonia solution (sp. gravity of 0.9) and diluting to 250 mL with distilled water in a conical flask. To prepare a buffer solution of pH = 10, 70 g of ammonium chloride was dissolved in 570 mL of ammonium hydroxide (sp gr. 0.90) and marked up the volume to 1000 mL with distilled water in a volumetric flask (Birendra and Pandey 2014).
The titration was carried out at a pH of 10, in an NH3−NH4+ buffer, which keeps the EDTA (H4Y) mainly in the half-neutralized form, H2Y2− where it complexes the Group IIA ions very well but does not tend to react as readily with other cations such as Fe3+ that might be present as impurities in the water.
From the collected filtered water through each of the ceramic filters 20 mL of the sample was pipated in a clean 250 mL conical flask for each trial and 2 mL of ammonia buffer solution followed by 1 mL of EBT then titrated with EDTA solution. The concentration of metal ion was calculated from 1:1 mol ratio of EDTA and metal ion. The concentrations of the cations were calculated in the samples as (ppm) and finally the removal efficiency of the ceramic filters was evaluated for each code of filter elements. The equation for the reactions that occur at end point of the titration is as follows:
Wine red sky bluewhere; H2Y2− is EDTA, HIn2− is an indicator, MgIn− is metal indicator, MgY2− is metal EDTA complex. For the determination of Ca2+ small amount (0.1 g) of magnesium chloride was added in the EDTA because the CaIn− is not very stable and the presence of Mg2+ in the solution ensures a sharp end point through the complexation of the EBT indicator with the magnesium ions present.
Iron removal test
The iron removal efficiency of ceramic filters were performed with single beam UV–visible spectrophotometer (XP-1000P, china, number 2000 to 8004) for water sample taken from Sana river. It was tested in Hawassa University Environmental Enginering Laboratory. In the iron determination, stock solution of Mohr‟s salt [Fe(NH4)2(SO4)2·6H2O] 1000 ppm was prepared by dissolving 6.97 g of the salt in 500 mL beaker then transferred to 1000 mL volumetric flask and filled to the mark. Standard solutions at different concentrations (100 ppm, 10 ppm, 8 ppm, 6 ppm, 4 ppm and 2 ppm) were prepared from stock solution for the calibration of UV–visible spectrophotometer instrument. The concentration of 1,10 phenanthroline was 3 times the concentration of Mohr’s salt because 1 mol of Mohrs salt forms orange red color complex [(C12H8N2)3Fe]2+ with 3 mol of 1,10 phenanthroline as shown the color in Fig. 1.

Magnesium, calcium, sulphate and phosphate removal efficiency %
The absorbance of the red complex produced was measured with a spectrophotometer at a wavelength of 510 nm. Hydroxylammonium chloride is used as a reducing agent for the conversion of iron (III) to iron (II) in the solution.
Before UV determination 1 mL HCl, 5 ml hydroxyl ammine, 3 ml sodium acetate, 5 ml 1,10 phenanthroline were added by taking 10 ml solution from each of the standard solution and blank solution then the solutions were filled up to mark with distilled water in 100 ml volumetric flask.
The same procedure was followed for the source water (before filtration) and filtered water (after filtration) by taking 5 mL and 10 mL water respectively then filled up to the mark with distilled water. After 1 h, the UV–visible spectrophotometer instrument was calibrated with standard solution of different concentration and blank solution the absorbance of the source water and filtered water was measured and the concentration was calculated with (ppm) based on the equation of the standard solution from the calibration graph at 510 nm.
Nitrite removal test
The nitrite test was conducted in Analytical chemistry laboratory of Hawassa University using single beam UV visible spectrophotometer (XP-1000P, china, number 2000 to 8004). The laboratory prepared solution of 0.01 M NaNO2 was used to percolate through the ceramic filters and to analyze the removal efficiency of the ceramic filter elements. The stock solution of 1000 ppm was prepared dissolving 1.456 g sodium nitrite in 1000 mL volumetric flask and filled to the mark with distilled water. The standard solutions of (100 ppm, 10 ppm, 8 ppm,6 ppm, 4 ppm and 2 ppm) were prepared from stock solution for standardization of the instrument. Solution of 0.025 M Paranitroaniline and 0.025 M 1-naphthol were prepared from the mass of 1.726 g paranitroanilin and 1.802 g of 1-naphthol by dissolving in 1000 mL volumetric flask and filled up to the mark separately. Nitrite under acidic conditions is go through diazotisation with paranitroaniline in ice bath and is formed violet colored complex with 1-naphthol under basic condition. All the chemicals used were analytical reagents.
Conductivity and pH test
Conductivity analysis of the source river water and the filtered water through the ceramic elements were performed with Conductivity Meter. The pH of similar source water and filtered water were analyzed with pH-016 pH METER. For conductivity test, standard solution of KCl was prepared with concentration and conductivity of 0.7455, 0.0746 and 0.0149 ppm to confirm the suitability of the instrument. The pH value of 4 and 8 buffer solutions were used to sustain the measurement of pH of the source and filtered water.
Porosity of ceramic filters analysis
Porosity of the ceramic filters was determined using the water absorption test (direct) method. It was a destructive method because three different samples weighing (50 g, 60 g and 100 g) were taken and the average porosity of these three samples was the apparent porosity of a ceramic filter. The samples were weighed when dry in air then saturated in distilled water at room temperature for 20 h. The water with the samples was then boiled for about two hours and allowed to cool to room temperature for another 20 h. This was done to ensure that the air in the open pores of the filter samples was replaced by the distilled water. The soaked samples were weighed under distilled water then removed and surface wiped with tissue paper and weighed in air. The weight of the wire was subtracted from the value obtained while determining the weight of the sample suspended in water. Apparent porosity (P) was then calculated using the expression given below (D’ujanda 2015).
where; Wsaturated is the weight of the specimen when saturated in water, W dry is the weight of the dry specimen and Wunderwater is the weight of the sample underwater.
Statistical analysis
Data analyses were performed with the statistical analysis system (SAS Institute 2009). The data generated on efficiency of ceramic filtrates made from different proportion of saw dust, grog and clay were subjected to analysis of variance (ANOVA) using the general linear model procedure. Least significant (LSD) test was used to determine the differences among the efficiency of ceramic filtrates based on the level at P = 0.05.
Results and discussions
The results obtained throughout the evaluation efficiency process of ceramic filter by varying the ratio of raw materials and firing temperature as well as the different tests done on the contaminates removal efficiency of the filters were discussed in this section. The ceramic filters processed for this work were found to be light golden brown in color (Fig. 2). This might due to the existence of iron(III) oxide in the clay samples (Akpomie et al. 2012).

Ceramic filters shape flower pot, disc, and candle
Microbial removal efficiency
The initial concentrations of E. coli and total coli form in Sana water which was used for microbial removal test were found to be 97 and 86 CFU/100 ml, respectively. As indicated in Fig. 3, the efficiency of the ceramic filters to remove total coli form and E. coli form bacteria were ranged from 77.32 to 96.51%. Also, the result of this study showed that the microbial removal efficiency of the ceramic filters increase with increase in the percentage composition of clay and firing temperature. The least removal efficiency registered 77.32% for total coli form and 77.9% E. coli for ceramic water filter code 1. This is most likely obtained due to high porosity of the filter element because of the high percentage composition of burn out. Ceramic water filters with relatively low porosity have good efficiency in removing microbial from bacterially contaminated water sources (Clasen et al. 2007). When microorganism pass through the pores of ceramic filters, there might be strong suffocation on their path due to the tourtosity of the path and at the same time they compete for feeding which reduce the number of microbials after filtration (Watters 2010).

Microbial removal efficiency of the ceramic filters of different code
The result of this study showed that most of the developed ceramic filters for this work were found to be effective in removing microorganisms from contaminated water as compared with WHO guidelines (WHO 2012). Figure 3, also shows that the E. coli removal efficiency of all the ceramic filters was relatively higher than the total coli form removal efficiency of the filter elements. The statistical ANOVA analysis confirmed that there was a significant difference in the total coliform removal efficiency of ceramic filters (p < 0.05).
Ceramic filters with lower percentage composition of burn out code 1,2,3 and code 4,5,6 were confirmed no significant variation however ceramic filters code 7,8,9 were showed significant variation compared to others filter codes 1,2,3 and code 4,5,6. Ceramic filters with similar composition of clay to saw dust ratio and fired at temperature of 750 °C and 800 °C have more or less the same removal efficiency of microbials.
Effect of porosity on microbial removal efficiency
Porosity of the ceramic filter is the basis for removing particles in micro size level with physical process like clogging, inertia and adsorption. Figure 4, displays the relationship between E. coli removal efficiency (ECRE) and total coliform removal efficiency (TCRE) with porosity of the ceramic filter elements. The result of this study agrees with the finding of Hagan et al. (2008) who reported that less porous ceramic filters are be able to remove microorganisms efficiently. The burn-outs were leaving smaller pores of about one micron size during ceramic filters firing which can filter out the majority of harmful microbes. Good removal efficiency was observed on the ceramic filter fired at 800 °C with porosity 51.63%. Microorganisms with large size are blocked within pore and retain from flowing through the ceramic element (Doulton 2009). Ceramic filters code 7,8 and 9 had different porosity but they were not differ significantly in removing total coliform and E. colifrom from water (p > 0.05).

Total coliform removal efficiency (TCRE) and E. coliform Removal efficiency (ECRE%) vs Porosity %
Turbidity removal efficiency
The turbidity removal efficiency of the filters was varied from 31.11 to 82.11% (Table 2). The result of this study confirmed that the turbidity removal efficiency of a filter was affected by porosity of the filter element. As indicated in Table 2, increasing the percentage composition of the burn-out material were reduced the turbidity removal efficiency of the ceramic filters. The ceramic pot manufactured with potential to reduce turbidity by 30% to 100% as reported by Lantagne et al. (2001) and Chung et al. (2013). In many parts of the sub Saharan region the water turbidity can be caused by organic waste, silt, bacteria and other germs, and chemical precipitates (Bielefeldt et al. 2009). The statistical analysis of turbidity removal efficiency indicates that there was no a significance difference in turbidity removal efficiency of the ceramic filters having different percentage composition of clay to saw dust (p > 0.05). Ceramic filters with high percentage composition of saw dust used in the production of the filter elements code 1, 2 and 3 were greatly differ from ceramic filters code 7,8,9 in turbidity removal efficiency.
Flow rate of the ceramic filters
As it can be seen from Fig. 5, the flow rate increases with increase in the combustible material that combined with clay. Such flow rate trend of the filter elements might be as the clay decrease there is a corresponding increase in the combustible materials which burn off leaving networked pores that in turn leads to increase the flow rate of the ceramic pot filters. The flow rates of the ceramic filters were depends on the porosity of the filter elements especially with interconnected pores. The flow rate of code 7 ceramic filter that fired at 700 °C temperature was surprisingly high. This might be the consequence of firing temperature for the formation of relatively high porosity ceramic filters.

Flow rate of ceramic filters
Filters with larger surface area have a greater flow rate whereas filters with small surface areas have lower flow rates (Halem, 2006). Statistically, there was a significant difference in the flow rates between ceramic filters with different percentage composition of clay and saw dust (p < 0.05.
Porosity test
As shown in Fig. 6, the porosity of the ceramic filters was decreased with the decrease in the percentage composition of saw dust used for different code of the filter elements. This may be due to filters with more combustible materials have more void space. The porosity of the fired mass is roughly proportional to the volume of combustible matter added (Kabagambe 2007).

Porosity of different filters with codes
Ceramic filter manufacturing industries have been used up to 200 tone of pressure in molding the filter elements. Such molding materials, could be exert pressure homogeneously and remove water absorbed by green ceramic filter. This is the reason why ceramic filters produced industrially for marketing have relatively lower porosity of average (48%) and free from cracking while our ceramic filters fabricated in this research work were hand molded and relatively had average (56.66%) higher porosity than commercial ceramic filters that is indicated in (Doris van 2006).
Effect of porosity on flow rate
Table 3 shows that the flow rate of the ceramic filters was generally decrease with decrease in the porosity of the ceramic filter elements. The minimum flow rate observed was 150 mL/h for filter code 8 and 9 having porosity 53.06% and 51.63% respectively while higher flow rate was 350 mL/h for filter code 1 with porosity 63.91%.
High porosity means there are larger number of void space in the ceramic filters that will allow the water to pass through the filter elements. If there are more pores in the filter then water might be flow through faster. The study results support this suggestion in that as the percentage of sawdust increased for each filter codes so did the flow rate. Porosity in a ceramic water filter allows for water to flow through the element (Yoko et al. 2002). The flow rate was not only affected by the porosity of the filter element but also it was affected by the turbidity level of the source water. Source water with high turbidity will have low flow rate because the pores of the filters will be clogged with larger particle sized insoluble solids.
Effect of porosity on turbidity removal efficiency
Figure 7 shows that, the turbidity removal efficiency of the filter elements decrease with increase in porosity of the ceramic filters. Ceramic filter with the lowest porosity (49.13) was showed higher turbidity removal efficiency 87.93% for the ceramic filters made with similar percentage composition of clay and burn-out but fired at different temperature during the production process. Filters with diminutive pores would be better at reducing turbidity and microbiological contamination but may have very slow flow rates (Yoko et al. 2002).
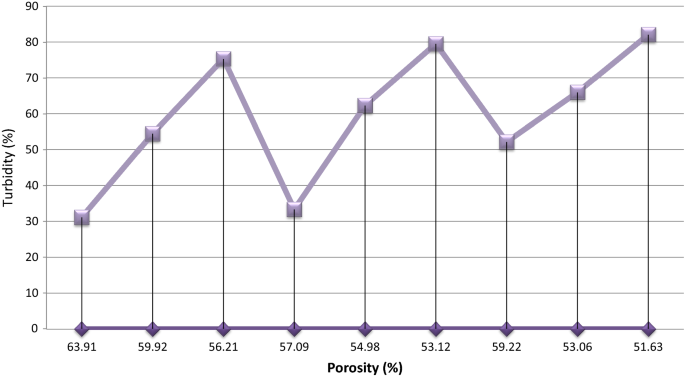
Turbidity % vs Porosity %
Comparing the least significant difference value with the differences between the means was suggested that removal efficiency of ceramic code 4,5,6 and code 7,8,9 do not differ significantly from each other. However, code 1,2,3 were differ significantly from the other groups (P < 0.05).
Effect of firing temperature on porosity
As described in Table 4, porosity of the ceramic filters was decreased with increase in firing temperature for the same composition of clay and burn-out fired at different temperature. The filters sintered at lower temperature show the highest and the most attained porosity as compared to others. This was happened as the sintering temperature increases, the particles attached to like the polymer network move towards each other and when the network collapse at the peak temperature can result in shrinkage that can result in reduction of pore size and distribution. As it can be seen from the above Table 4, more efficient ceramic filters from different percentage composition of clay to saw dust were attained at 800 °C firing temperature. Moreover, Fig. 8 shows that the effect of firing on the porosity of the filter elements in ceramic code 1, 2 and 7 indicated that more efficient porosity in removing turbidity and microbial was achieved at 800 °C (code-9). Turbidity and microbial removal efficiency of the ceramic filters fired at 800 °C was more efficient, therefore; firing the ceramic filter at 800 °C (Tables 3 and 5).

Porosity vs firing temperature
There was significant different of porosity for ceramic filter fired at different firing temperature, p < 0.05. Statistical ANOVA analysis indicate that ceramic filters of code 1,4,5 fired at 700 °C differ significantly in porosity from ceramic filters having codes 2,5,8 and codes 3,6,9 fired at 750 °C and 800 °C. This analysis indicates that at a higher temperature the clay particles start to melt and reduce the porosity of the green ceramic by the firing processes. The four stages of sintering are: solid state sintering at this stage the shaped green body is heated to a temperature that is slightly different from its melting point and no liquid is present atomic diffusion reduce the porosity, liquid phase sintering a small amount of liquid is produced and the liquid volume is insufficient to fill the pore space, vitrification is a stage where relatively large volume of liquid is formed and sufficient to fill the volume of the remaining pores and viscous sintering is consolidated mass of glass particles is heated near to or above its softening temperature (Lutgard and Mohamed 2003).
Removal efficiency of water hardness agents
The result of this study showed that ceramic filters had good removal efficiency of Mg2+ and Ca2+ that cause for hardness of water (Table 6). The removal of calcium and magnesium ions might be due to the ion exchange on the ceramic surface and formation of precipitation as oxides and hydroxides of these cations. The central cations in clay structure, aluminium and silicon with higher charge might be replaced with lower charge like magnesium and calcium by leaving net negative charge. Generally, water hardness removal efficiency of the filter elements increase from ceramic filter code 1 to 9 with decrease in the percent composition of burn-out. The WHO guideline values are given for the concentration of calcium 100–300 mg/L and magnesium 200 mg/L in drinking water (WHO 2012). There was no significance difference in the water hardness agent removal efficiency among different code ceramic filters (p > 0.05). A ceramic filter made from saw dust, snails shell glass and clay could be remove 50.8% hardness and 96% iron from steam water by firing with 750 °C temperature (Babafemi and Yinusa 2015).
Iron removal efficiency
There is a slight decrease in the removal efficiency with the decrease in percentage composition of the saw dust in the production of filter elements; this might be due to the decrease in porosity of the ceramic filters. Adsorption of cations might be affected by the surface area in contact of adsorbent and adsorbate this surface area in contact increase for highly porous ceramic filters.
The interaction between a negatively charged clay surface and the cations in the pore water could be generated an electric double layer. This was an important phenomenon and this and it could be described in terms of the retation of cation in the pore. The central ions of clay structure might be replaced by others in changing the environment like pH of water in the ceramic pores. From statistical analysis test showed that there is no significance difference in iron removal efficiency among the ceramic filters formed from different percentage composition of clay and burn-out materials, p > 0.05..
Nitrite removal efficiency
The result of this study showed that the ceramic filters remove nitrite from water solution with removal efficiency minimum 11.8% of ceramic filter code 1 and maximum 70.6% with the ceramic filter code 9 (Table 7). There is a general trend of increase in the removal efficiency with an increase in percentage composition of the clay with different codes of the ceramic filters and from the statistical ANOVA test there is significant difference between the ceramic filters composed of different percentage of clay to saw dust, p > 0.05. The least significant different confirms the existence of great significant difference in removal efficiency of nitrite between ceramic filters code 1,2,3 having high percentage saw dust and filters code 4,5,6, code 7,8,9 with low percentage of saw dust. The nitrite removal efficiency of the ceramic filters might be exclusion within the pores of the ceramic filters according to size.
Resistivity(R), conductivity (cond) and pH of ceramic filters results.
The pH value of the source water was relatively high and it was decreased after filtration in all the ceramic filter codes. Higher pH conditions could enhance adsorption of positively charged ions. There was no significance difference in conductivity of water filtered with ceramic filters made from different percentage composition of clay to sawdust, p > 0.05. Electrical conductivity is directly related to the amount of ions present in a given solution (Adhena et al. 2015).
Conclusion and recommendation
The efficiency of the ceramic filters was evaluated with average removing; turbidity 59.6%, total coliform 86.3%, E. coli 87.6%, calcium 56.9%, magnesium 59.02%, sulphate 88.98%, phosphate 76.2%, iron 52.88%, nitrite 46.23% and flow rate 226.66 mL/h in the analysis. Most of the ceramic filters were removed microbial from the contaminated river water effectively quantity compared to the WHO standard. Effect of different parameters such as percentage composition of clay to sawdust, firing temperature and porosity were investigated for the efficiency of removing microorganisms, turbidity, hardness agents and nitrite of water with the ceramic filter elements. The ANOVA test confirmed the existence of significant difference between ceramic filters in removal of microbials and flow rate which are made from different percentage composition of clay to saw dust and different firing temperature. There is no significant different between ceramic filters made of different percentage composition of clay to saw dust in removing cations. Using ceramic flowerpot filter for the treatment of water can replace importing household water treatment technology and increase the income of local potters. Based on the results observed in the previous part more efficient removal were observed at percentage of clay 80%, sawdust 25% and grog 5% (code-8 and code-9) at firing temperature of 750 °C and 800 °C with lower porosity of the ceramic filter elements were the best removal efficiency.
In order to make the result of this study more practical, the more study need on the social pilot program on the implementation of the ceramic filter in urban and rural area of the country.
Abbreviations
- 0C:
-
degree celsius
- WHO:
-
World Health Organization
- CSF:
-
ceramic silver pot filters
- EDTA:
-
ethylene diamine tetra acetic acid
- TCRE:
-
total coliform removal efficiency
- ECRE:
-
E. coliform removal efficiency
- CFU:
-
colony forming unite
- ANOVA:
-
analysis of variance
References
Adhena A, Belay Z, Angaw K, Jemal Y (2015) Physico-chemical analysis of drinking water qualityatJigjiga City, Ethiopia. Am J Environ Protect 4(1):29–32
Akpomie G, Abuh M, Ogbu C, Agulanna A, Ekpe F (2012) Adsorption of Cd(II) from solution by nsu-clay: kinetic and thermodynamic studies. J Emerg TrendsEng App Sce 3(2):253–258
Babafemi A, Yinusa D (2015) Formulation of ceramic water filter composition for the treatment of heavy metals and correction of physiochemical parameters in household water, Ado-Ekiti, Nigeria Scientific Research Publishing Inc. Art Design Rev 3:94–100
Bielefeldt AR, Kowalski K, Summers RS (2009) Bacterial treatment effectiveness of point-of-use ceramic water filters. Water Res 43:3559–3565
Birendra S, Pandey I (2014) Determination of calcium and magnesium in clinker, cement and fly, ash based cement by EDTA without using masking reagents. Int J Adv Eng Appl Sci 3(4):9
Chung DH, Kimatu JN, Nyariki KO, Su KJ, Onura KN et al (2013) Introducing efficient low cost smoked pots for water purification for developing countries. Hydrol Current Res 4:152. https://doi.org/10.4172/2157-7587.1000152
Clasen T, Boisson S (2006) Household-based ceramic water filters treatment of drinking water in disaster response: an assessment of a piloprogramme in the Dominican Republic. Water Pract Technol 1(2):1–9
Clasen T, Schmidt W, Rabie T, Roberts I, Cairncross S (2007) Interventions to improve water quality for preventing diarrhoea: systematic review and meta analysis. BMJ 334(7597):782
Doris van (2006) Ceramic silver impregnated pot filters for household drinking water treatment in developing countries, Master of Science Thesis in Civil Engineering Sanitary Engineering Section. Department of Water Management Faculty of Civil Engineering Delft University of Technology, p 16
Doulton (2009) Doulton Water Filter Ceramic Candle & Cartridge Technologies http://doultonusa.com/HTML%20pages/technology
D’ujanda F (2015) Modeling the Porosity Dependence of the Electrical Conductivity of Kaolin. Ph.D. thesis, Mamerere University
Elmore V et al (2005) Toxicant and parasite challenge of Mainz Intermittent Slow. Environ Toxicol 14(2):217–225
Enyew Amare and Tesfaye Betela (2017) Clay ceramic filter for water treatment. Mater Sci Appl Chem 34:69–74
Hagan J, Harley N, Pointing D, Sampson M, Soam V (2008) Ceramic water filter handbook. Resource Development International, Siem Reap
Halem D (2006) Ceramic silver impregnated pot filters for household drinking water treatment in developing countries. Delft University of Technology, Netherlands
Ilker E, Sulaiman A, Rukayya S (2016) Comparison of convenience sampling and purposive sampling Department of Biostatistics, Near East University, Nicosia-TRNC. Cyprus Am J Theor Appl Stat 5(1):1–4
Kabagambe M (2007) Performance of ceramic water filters made from selected Uganda clays for point-of-use. Makerere University, Kampala
Kabagambe M (2010) Performance of ceramic water filters made from selected uganda clays for point-of-use. Makerere University, Kampala
Lantagne D, Quick R, Mintz E (2001) Household Water Treatment and Safe Storage Options in Developing Countries: A Review of Current Implementation Practices. Geneva, Water Supply and Sanitation Collaborative Council
Lutgard C, Mohamed N (2003) A hand book of advanced ceramics. Elsevier, New York
SAS/STAT 9.1 User’s Guide (2009) SAS Institute Inc. USA; North Carlolina, 2nd edn. SAS Institute Inc., Cary
Sobsey SK, Boschi P, Velebit L (2008) Estimating child mortality due diarrhea in developing countries. Bulletin 86(9):710–717
Watters T (2010) The effect of compositional and geometrical changes to the bending strength of the ghanaian ceramic pot filter. Masters of Engineering thesis, MIT, Department of Civil and Environmental Engineering, Cambridge, MA, USA
WHO (2012) Joint monitoring program for water supply and sanitation estimates for the use of improved drinking-water sources ethiopia. WHO, Geneva
Yang A, Shang C (2004) Chlorination byproduct formation in the presence of humic acid, model nitrogenous organic compounds, ammonia, and bromide. Environ Sci Technol 38(19):4995
Yoko N, Yoshihiro S, Michio I (2002) Sorption Kinetics of heavy oil into porous carbon. Water Res 36:5029
Authors’ contributions
AL supervised data collection and interpretation; helped to draft the manuscript as well as approved the final manuscript. GA collected, analyzed and interpreted the data, which was part of his MSC thesis of Analytical Chemistry at Wolaita sodo University, Ethiopia. Both authors read and approved the final manuscript.
Acknowledgements
We would like to thank, Angecha district, at Kembata Tembaro zone for the scholarship and for financial support.
Competing interests
The authors declare that they have no competing interests.
Availability of data and materials
Data generated during this research work can be available upon request.
Consent to publication
This research work did not involve human subject for experimental purpose and informed consent to participate in the study.
Ethics approval and consent to participate
The ethical clearance was not required for this particular research because it nether included animal nor plant.
Funding
Financial support obtained from Angecha District, Kembeta Tembaro zone.
Publisher’s Note
Springer Nature remains neutral with regard to jurisdictional claims in published maps and institutional affiliations.
Author information
Authors and Affiliations
Corresponding author
Rights and permissions
Open Access This article is distributed under the terms of the Creative Commons Attribution 4.0 International License (http://creativecommons.org/licenses/by/4.0/), which permits unrestricted use, distribution, and reproduction in any medium, provided you give appropriate credit to the original author(s) and the source, provide a link to the Creative Commons license, and indicate if changes were made.
About this article

Cite this article
Bulta, A.L., Micheal, G.A.W. Evaluation of the efficiency of ceramic filters for water treatment in Kambata Tabaro zone, southern Ethiopia. Environ Syst Res 8, 1 (2019). https://doi.org/10.1186/s40068-018-0129-6
Received:
Accepted:
Published:
DOI: https://doi.org/10.1186/s40068-018-0129-6