- Research
- Open access
- Published:
A hierarchical analysis of ecosystem classification with implementing in two continental ecoregions
Environmental Systems Research volume 10, Article number: 39 (2021)
Abstract
Background
The ecosystem classification of land (ECL) has been studied for a couple of decades, from the beginning of the perfect organism system “top-down” approach to a reversed “bottom-up” approach by defining a micro-ecological unit. After comparing two cases of the ecosystem classification framework implemented in the different continental ecoregions, the processes were carefully examined and justified.
Results
Theoretically, Bailey’s upper levels of ECL (Description of the ecoregions of the United States, 2nd ed. Rev and expanded (1st ed. 1980). Misc. Publ. No. 1391 (Rev). Washington DC USDA Forest Service; 1995) were applied to the United States and world continents. For the first time, a complete ECL study was accomplished in Western Utah of the United States, with eight upper levels of ECOMAP (National hierarchical framework of ecological units. U.S. Department of Agriculture, Forest Service, Washington, DC. https://www.researchgate.net/publication/237419014_National_hierarchical_framework_of_ecological_units; 1993) plus additional ecological site and vegetation stand. China’s Eco-geographic classification was most likely fitted into Bailey’s Ecosystem Classification upper-level regime. With a binary decision tree analysis, it had been validated that the Domains have an empty entity for 500 Plateau Domain between the US and China ecoregion framework. Implementing lower levels of ECL to Qinghai Province of China, based on the biogeoclimatic condition, vegetation distribution, landform, and plant species feature, it had classified the Section HIIC1 into two Subsections (labeled as i, ii), and delineated iia of QiLian Mountain East Alpine Shrub and Alpine Tundra Ecozone into iia-1 and iia-2 Subzones. Coordinately, an Ecological Site was completed at the bottom level.
Conclusions
(1) It was more experimental processing by implementing a full ECL in the Western Utah of the United States based on the ECOMAP (1993). (2) The empty entity, named as Plateau Domain 500, should be added into the top-level Bailey’s ecoregion framework. Coordinately, it includes the Divisions of HI and HII and the Provinces of humid, sub-humid, semiarid, and arid for China's Eco-Geographic region. (3) Implementing a full ECL in a different continent and integrating the lower level's models was the process that could handle the execution management, interpreting the relationship of ecosystem, dataset conversion, and error correction.
Instruction
The ecological classification and units had been studied and monitored on neighbors’ states with relations of environmental conditions, biological characters, and ecosystem services (Clark et al. 2001; Wallace 2007; Khaiter and Erechtchoukova 2018). Ecologists had proposed and classified the land into simplified ecosystems such as rainforest, forest, tundra, and desert, savanna, where the different plants, animals, and bacteria populations were living together. By looking into different scales, geographers and ecologists found out and depicted the ecosystem as systemically organized, nested, and multiple layers (O'Neil et al. 1986, 1995, 1986; Bailey 1983). They considered the ecosystem as complex and unstable depending on the seasonality, time, and landscapes (Hutchinson et al. 2005) and classified the land into hierarchy ecosystem units (Bailey 1995, 1996a,b). Based on prior selected criteria, identifying ecological boundaries and classifying the land into the ecoregions (Creque et al. 1999; Bailey 1983, 1986; Ecological Stratification Working Group 1996; West et al. 2005; Albert et al. 2015) presented long historic battle and academic progress in the last 30 years.
The large amount of data stored in the computer system in digital or raster formats made quantitative and spatial analyses more valuable and practical in the last two decades. For example, De'ath and Fabricius, in 2000, used the tree technique to explore the analysis of complex ecological data with nonlinear relationships and high-order interaction. Traditionally, many studies and attempts to analyze the complex system of the land as dynamically organized and structured across the scales of space had assisted ecological researchers to solve population richness and dynamics (Allen et al. 2014), vegetation distributions (Hou 1983; Zhang and Zhou 1992) and ecosystem classification framework (Bailey 1995, 1996a,b; Cleland et al. 1997; Wu et al. 2003a, b; Altert et al. 2015; Brodrick et al. 2019).
Bailey started to identify and delineate the boundaries and the ecoregions of the United States, North America, and the world's continents from 1976 to 1998. His works were published and had made significant progress in the 1990s. In 1993, his work divided the ecoregion into the top three levels of Domain, Division, and Province. At the Domain level, applying the Köppen climate system of classification, Bailey (1996a, b; 1983, 1995) depicted the Domains with the synthetic description of the land surface form, climate, vegetation, soils, and fauna.
Since Federal Geographic Data Committee (FGDC) in the United States accepted the National Hierarchy of Ecological Units (NHEU), ECOMAP (1993) had been created with eight levels hierarchical approach to study the ecosystem classification of land (ECL). The subregions below the Domain, Division, and Province were divided into the section and subsection, landtype association, landtype, and landtype phase. Thus, NHEU had produced a classified Ecosystem Classification of Land into the eight levels' nested hierarchies.
Chinese geographers and ecologists started to measure and study geographic regionalization and broad scale of ecological units and had developed quantitative analysis methods for studying regional ecosystems (Zheng 1999; Wu et al. 2003a, b; Sun et al. 2010). Detailed vegetation map, soil type map and grassland map, ecosystem services had been used for the ecoregion studies at the national scale (Hou 1983; Fu 2001; Yue et al. 2006). The remote sensing and Geographic Information System (GIS) and modeling had been applied to study the ecosystem services, landscape, ecoregion classification, and delineation boundaries (Zhang et al. 2016, 2017; Zhou et al. 2020; Wang et al. 2020).
The decision tree method, a top-down approach with origins in the field of statistical technique, is recognized as having great promise to advance understanding and prediction about ecological phenomena. This modeling technique is flexible to handle complex problems with multiple interacting elements and typically practical approaches, e.g., generalized linear models, no-linear models, for classifying ecosystems (De'ath et al. 2000; Olden et al. 2008; Allen et al. 2014). Debeljak and Džerosk (2011), Yates et al. (2018) used the decision tree algorism to study the ecosystem complexity and nested multiple layers. This method was used to help actualize both categorical and continuous dependent variables under a supervised learning process for comparing the ecosystem classification between the United States and China. The algorism splits the selected classes into two or more homogeneous sets based on the most significant attributes, or charters making the groups as distinct as possible.
In the global context of ecosystem classification of land should be able to understand the landscape-scale processes in a more general way. The issue is not whether we can generalize about landscape-scale variation and combination of abiotic and biotic factors, but to identify the circumstances in which generalizations can be made, and where there are limits, and find a solution (Hutchinson et al. 2005; West et al. 2005; Olden et al. 2008; Albert et al. 2015; Brodrick et al. 2019; Hornsmann et al. 2008). It further examined the hierarchies of ecosystem classification when the working experiences and research cooperation could be conducted in different continents.
Applying environmental management, modeling, and exploration of environmental information systems, the key stakeholders identified their participatory goals in considering as important roles (Khaiter et al. 2018). As a tool implementing the tasks conceptualized in the Unified Modeling Language (UML) meta-model, the three groups of graphical models such as a functional, object, and dynamic aimed to provide a standard notation and describe different aspects of the modeling. Similarly, the objective classification can base on the characteristics of segment or pixel size, shape, texture for classifying land use and land change (Paul et al. 2018). Using the “ecosystem approach” as the primary framework of the Convention on Biological Diversity (CBD; United Nations 1992), a holistic way was proposed to assess and manage ecosystems considering all plant, animal, and bacterial communities and their non-living environment. From 1992 onwards, the objectives of the CBD have been gradually incorporated into international environmental legislation, considering the “ecosystem approach” by declaring the inclusion of multiple taxonomic groups into environmental monitoring (Mueller et al. 2014; Mengist and Soramessa 2019).
Although Bailey had applied his ecosystem classification from the United States to global scales, many early studies stayed at certain level applications depended on the mapping scales. The idea of integrating models to solve the complex system and its problem had been assessed and tested in a general modeling process (Wiegand et al. 2013; Wang and Grant 2019a, b). In this paper, we tried to compare the ecosystem classification framework between the United States and China, solve any Domain related issues, integrate Baily’s ECL theory with the existing ecosystem classification models, and justify the lower levels of ECL. Two sets of study data between Western Utah of the United States and Qinghai province of China were scrutinized and implemented within the limited budget.
Methodology and analysis
The review of two cases of upper levels of ecosystem classification of land
Comparing and assessing upper levels of ecoregions between the United States and China
The ecosystem can be a complicated system that varies along with longitude, latitude, and elevation on the earth's surface and is constantly adapted to macroscales' slope, aspect, and environmental variables (Allen et al. 2014; Brodrick et al. 2019). Bailey (1995, 1996a,b) had made his contributions on mapping the ecoregions of the United States, North America, and world continents. Theoretically, Bailey’s Ecosystem Classification had explained the ecoregions and their nested structures in the upper levels of Domain, Division, and Province.
Zheng (1999) and Wu et al. (2003a; b) compared the ecosystem classification between China and the United States. Since they used the temperatures, water conditions, and landforms for the upper levels of ECL, there were similarities between these two ECLs. However, there were some failures to match each level among the upper three levels. For example, at the top level, China ECLs mainly used the accumulated temperature and the days of great than 10°C, and next level used the "aridity" to classify as Humid, Sub-Humid, Semi-Arid, and Arid (Labeled as A, B, C, D separately) and used landform types to classify Plain, Mountain, and Hills (Labeled as 1, 2, 3…etc.), as examples of HIB, HIB1, etc. (Table 1).
China's Eco-geographic classification is mostly fitted into Bailey’s Ecosystem Classification regime and represents its upper levels of the Eco-geographic region. Zheng (1999) and Wu et al. (2003a, b) had provided the theoretical analysis and delineated the boundaries for 11 eco-geographic zones. Unfortunately, the HI and HII eco-geographic zone in China did not correctly fit into any domain developed by Bailey. Bailey (1995, 1996a,b) initially had put HI and HII area into his framework as M310 Tropical /subtropical Steppe Regime Mountains and M320 Tropical/subtropical Desert Regime Mountain. Thus, Zheng and Wu et al. left an empty entity for the Domain of which HI and HII eco-geographic zones should have belonged.
The Domain Plateau was predicted by a binary domain decision tree in Fig. 1, and it was comparable with Domain Arctic and Domain Tropic. This Domain classification solved the problems about the tropical and subtropical regions having sub-polar and temperate zones in the high-elevation plateau and mountain regimes. HI, and HII eco-geographic zones were delineated (Zheng 1999) and named Plateau Sub-polar Division and Plateau Temperate Division separately. HI was classified with three different Provinces, in which HIB was delineated as Hilly Plateau of Golog-Nagqu Sub-Humid Province, HIC was delineated as Plateau with Broad Valley Semiarid Province, HID was delineated as the Kunlun Mountains & Plateau Arid Province. HII was classified with other three Provinces, which were HIIA/B was delineated as High Mountains of Gorges of W. Sichuan and E. Xizang Humid & Semi-Humid Province, HIIC was delineated as Plateau & Mountains Semi-Arid Province (E. of Qinghai, Qilian Mountains, and S. Xizang), and HIID was delineated as Qaidam Basin and N. Slopes of the Kunlun Mountains and Ngari Mountains Arid Province.

Binary domain decision tree and algorism
Based on Bailey’s (1995) and ECOMAP’s (1993), the next level classification was the Section based on mesoscale of landforms such as basin, watershed, and mountain terrain shape, pattern, geologic substratum, and geologic structure and scales. China's lower levels of ECL used the plains, hills, and mountains to classify, or equivalent to Bailey’s Sections, which were being named with numeric numbers 1, 2, and 3 such as HIB1, HIC1, HIC2, HID1, and HIIA/B1, HIIC1, HIIC2, HIID1, HIID2, HIID3. Theoretically, the predicted HI and HII with A, B, C, D, and intermediate types A/B, B/C, C/D, etc., can exist in the system in Table 1.
The analysis of two cases of lower levels of ecosystem classification of land
Implementing on lower levels of ecosystem classification in the United States
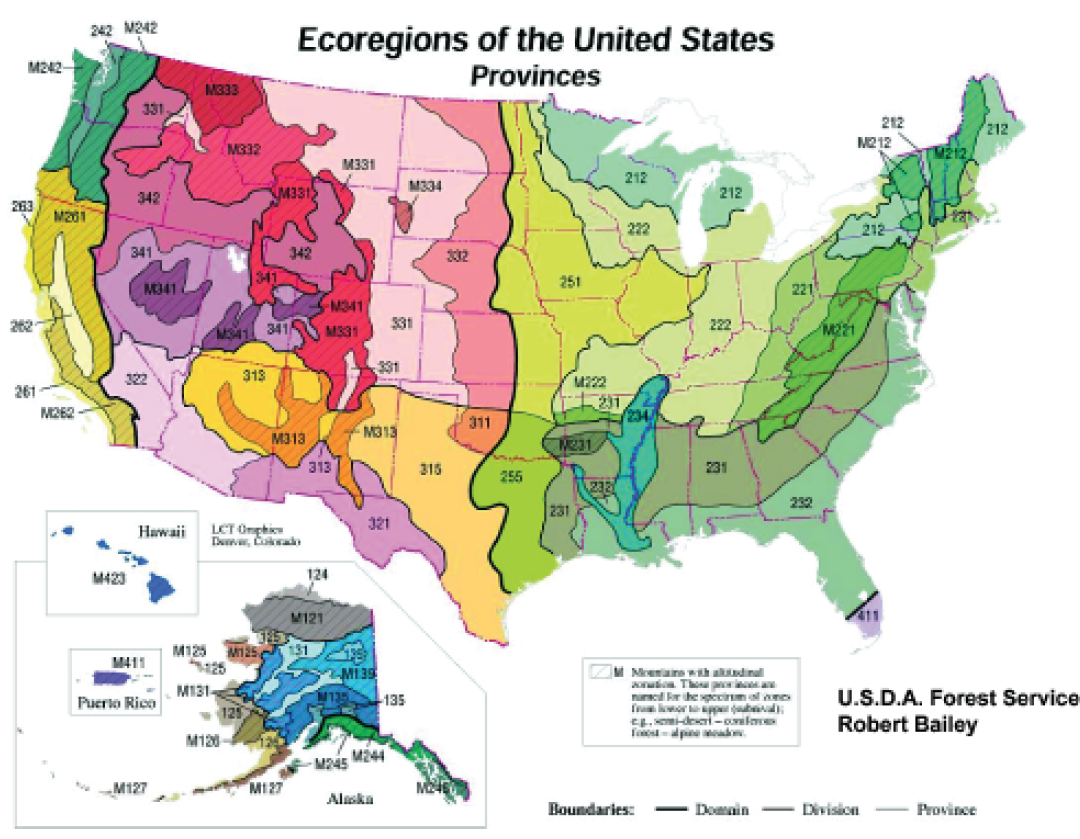
Ecoregions of the United States had been examined by Bailey (1995, 1996a,b) in great detail at Domain, division, and Province. The first case study was accomplished with the upper four levels for the project in a 4.5-million-hectare area centered in western Utah State (ECOMAP 1993). National Hierarchy of Ecological Unit (NHEU) had been set up to present as the coarsest boundaries of western Utah, the United States. This project started in 1995 and was conducted out in a team works. One of 300 Dry Domain and the Divisions area had bounders intersecting with 340 Temperate Desert Division and M340 Temperate Desert Regime Mountains Divisions; three Provinces are interesting with study area, 342 Intermountain Semi-Desert Province, M341 Nevada-Utah Mountains Semi-desert Coniferous Forest Alpine Province, and 341 Intermountain Semi-Desert and Desert Province. In addition, the study area intersects with Bonneville Basin Section, Central Great Basin Section and Northeastern Great Basin Section, and Northwestern Basin and Range Section (Fig. 2).

Upper four levels’ Domain, Division, Province, and Section in the study area
Eight levels’ ECOMAP Units were applied to the study area (Fig. 3A) and outlined ecosystem classification, the rules, and ecological features shown in Table 2.

A DEM landscape layout of Western Utah, the United States. B First Lower level of subsection of Western Utah, the Utah States
“Bolson” is a subsection used as a particular term in the lower level of ecosystem classification, describing the terrain. DEM data (30 m) was used in the model and generated 60 bolson segments (Fig. 3B). In the study area, the macroterain, mesoterrain, microterrain units were generated in the model with algorisms to identify and delineate their boundaries. The protocols (Fig. 4A) were used to identify landscape units between landtype association, landtype, and landtype phase one step at a time separately. The ecological sites (ESs), the 9th level, was designed to overcome the using important data on ESs, nested to ECOMAP; vegetation stands (VSs), the 10th and finest-grain level were subdivisions of individual polygons of ESs (Fig. 4B) based on differences in disturbance histories that have led to differing current vegetation structure and composition. The vegetation stands were defined and described in terms of vegetation characteristics that represent fine-scale variations in regional climate, site-specific moisture, nutrient regimes, and disturbance histories (fire, grazing and human activities).

A Flow diagram of Ecosystem Classification of Land from Bolson Segments to Vegetation Stands. B Map of the ecological sites in project sampling strip area
Implementing on lower levels of ecosystem classification in China
In our second study, Qinghai province is located in western China and the northeast part of the Qinghai-Tibet Plateau. The latitude is from 31° 39ʹ N to 39° 11ʹ N, and the longitude is from 89° 25ʹ E to 103° 04ʹ E. Thus, from south to north, there is almost a span of 8° that equates to 800 km, and from east to west, there is a span of more than 14° that equates to 1200 km (Zhou et al. 1987). The total area of Qinghai province is 720,000 km2.
Qinghai province is far away from the east-south coast of Mainland China, where the summer monsoon comes from the Pacific Ocean and brings the rainfall to the China continent. The warm and wet air mass mainly reaches the southeast provinces and leaves the western Qinghai province dry in summer and cold in the winter. Geographically, Qinghai province is located in the subtropical and warm-temperate climate zone. However, the average elevation of the province is increased over 3000 m above sea level, and the subtropical zone’s evergreen broad-leaved forest and warm-temperate zone’s deciduous broad-leaved forest are total disappeared and replaced by the alpine shrub, alpine tundra, alpine steppe, and alpine desert vegetation. The annual average temperature in the coldest month is under − 6.5°C in the whole province, and the annual average temperature in the warmest month is under 10°C in higher mountain regions (> 3500 m), 10°C–15°C for the valleys and mountain slop (2700 m–3500 m), above 15°C in the east agriculture region and west desert basin. In the summer season, the rainfall is in June, July, and August, taking by 80–90% of annual total precipitation. Qilian Mountain ridge is divided the north border from Gansu Province. Qaidam bison is located in the province's northwest, and the basin valley elevation is about 2600 m. The north border is linked with Altyn-Tagh mountain range. Southern Qinghai Plateau is named for the southern area of the Golog Mountains and Qinghai South Mountains, and the northern area of Tangula Mountains forms a central higher plateau in Qinghai (Fig. 5A).

The Qinghai province is within the 500 Plateau Domain as it was examined and defined, intersecting with HI, Plateau Sub-polar Division, and HII, Plateau Temperate Division (Fig. 5B). Therefore, HIC, HIIC, HIID, HIB, and HID are relevant to Provinces see Table 1. The Qinghai province region is intersecting with 6 Sections as HIC1 for Plateau with Broad Valley of S.Qinghai, HIIC1 for Plateau & Mts. of E. Qinghai and Qilian, HIID1 for Qaidam Basin, HIID2 for N. Slopes of the Kunlun Mts, HIB1 for Hilly Plateau of Golog-Nagqu, and HID1 for Kunlun Mts. & Plateau (Zheng 1999).
After assessing and justifying the upper levels of ECL, the lower levels of ecosystem classification in Qinghai province were generated by an objectively defined ecosystem Classification model in Fig. 7A and validated in Fig. 7B under HIIC1 Section and layout in Table 3.
Based on the biogeoclimatic condition, vegetation distribution, landform, and plant species feature, three levels of ECL for the Section HIIC1 were created and delineated as the subsection (i., ii.), Ecozone (ia, iia), and Subzone (ia-1, iia-1, iia-2) (Fig. 6).

Using Biogeoclimatic condition, generated lower levels of ECL under HIIC1 Section in the North Eastern Qinghai Province in China
Using DEM data and spatial analysis model (Zhang et al. 2008), the lowest level of the ecological site was classified, which was based on vegetation type, slope or aspect position (Fig. 7C).

A Objectively defined Ecosystem Classification. B Integration of Ecosystem Classification Models. C Haibai Alpine Tundra Ecological Sites
By using objectively defined algorism, the Ecological Sites map in the area of Haibei Alpine Meadow Ecosystem Station was generated. The map scales were changed from 1:3,000,000 (Subsection, ecozone, and subzone) to 1:50,000 in mapping Ecological Sites. Figure 7A presented a computer programing interface integration, which had a strong concept using objectively defined algorithms to achieve deliverable applications. Figure 7B presented integrating different levels of the ECL model with assessment, justification, and testing to reach the best solution of Ecosystem Classification in a different continent.
We had simulated the alpine tundra vegetation dynamics in response to global warming with scenarios of global annual mean temperature increase of 1° to 3° C. Since the study area was with the plain, lower hills, and glacier mountains, the ecological sites in Fig. 7C showed a good relation with the elevation, slope, aspect, temperature, and water condition (Table 4) (Zhang et al. 2008). This approach had been demonstrated and applied to the entire region of Qinghai-Tibet Plateau in China (Zhang et al. 2010) in the simulation of alpine tundra dynamics in response to global warming.
Results
Bailey’s (1995) M310, M320 as Mountain Regimes of Tropic and Subtropical Division had left an empty entry for Qinghai-Tibet region in the world ecoregion scale. The United States and China have similar latitude ranges, except for China having the highest plateau in the southwest part of the region. The binary decision tree analysis had approved that 500 Plateau Domain should be added to Bailey’s Ecosystem Classification of Land. The description of the 500 Plateau Domain should have HI and HII's characteristics (Zheng 1999; Wu et al. 2003a, b) and Climatic Tundra features (Bailey 1995; Belda et al. 2014).
The first study case in a dry domain area of western Utah of the United States, applying ten levels of ECL, would be more like a first tryout process based on the ECOMAP (1993). The second study case had been integrated with three levels' ECL models. Based on the biogeoclimatic conditions, we classified Section HIIC1 into two Subsections (labeled as i, ii), and delineated iia of QiLian Mountain East Alpine Shrub and Alpine Tundra Ecozone into iia-1 and iia-2 Subzone. Likewise, ia-1, HuangShui River watershed Forest, Temperate Steppe Subzone was delineated under ia of QingHai East-North temperate Steppe Ecozone.
Discussion
A “top-down” approach described by Rowe (1961), separated the ecosystem into components like organisms. We have pointed out that following a top-down nested hierarchy to its finest subdivisions counters common sense and practicality. Thus, a terrestrial ecosystem is a volume of earth space with organic contents, separated from its neighbors by reasonable divisions in the empirical continua of biota, soil, and physiography. However, the ECL framework could be changed when selecting different biotic and abiotic criteria in two continents or countries.
With reviewing the upper levels of ECLs in the United States and China, the ecosystem classification of land (ECL) was a comprehensive methodology to explore and classify the ecoregions in the different continents. Climatologists used relatively or multiple years’ annual climate conditions to demonstrate the uniform climatic classifications and applied them to ecological regionalization study. However, the differences of the geology and geomorphology caused uncertain changes within Domain, Division, Province, and Section, where we had to solve the issues in the next level classification (O'Neill et al. 1986; Cleland et al. 1997; West et al. 2005; Brodrick et al. 2019). After Bailey (1983, 1995, 1996a,b) classified upper levels of Ecosystem Classification of Land (Domain, Division, and Province), ECOMAP (1993) had been set up to present as the “top-down” approach of Ecosystem Classification of Land in the United States. Theoretically, Western Utah's project proved it was costly and time-consuming through a complete ECL's field survey and an intensive classification processing.
ECOMAP (1993) described a top-down regionalization that is hierarchically nested and explicitly geographic area. While hierarchical structures allow the related land classification units to be used at scales appropriate to various needs, from national to local, a consequence of the top-down, nested hierarchically that dominates the NHEU is that perimeter of outer polygons created at lower levels have to be vertically integrated with the delineation of polygons occurring at upper levels. One consequence of this "top-down" process is that if the lowest levels are produced independently of higher levels, one should logically readjust (merge from the "bottom-up") the congruent polygon boundaries involved in all affected polygons created at higher levels when we understood and considered the content of whole (Bailey 1983; West et al. 2005). In other words, we dissected wholes into parts based on differences so that classes and units are arrived at by subdivision.
However, there was a limitation in the first case study. It had the theory and the rules we can apply from a "top-down" approach. Nevertheless, for a large number of polygons with the difference to each other, we had very few data sources to validate at what level of statistical significance until the lowest level ecological sites or vegetation stands can be surveyed in the field (West et al. 2005; Zhang et al. 2008; Silver and Carrol 2013; Buruso 2018). Also, long-term experimental research and monitoring (McLennan et al. 2018), remote sensing applications had proved to benefit the ecosystem classification studies (Mueller et al. 2014; Berhane et al. 2018; Paul et al. 2018; Gebregergs et al. 2021). Therefore, in the future study, it is recommended to start from a watershed, a landform, a community county, a typical forest system, an ecosystem service region, a national reservation park, or a landowner's territory if more data is available.
In the second case study, comparing to upper levels of ECL between the United States and China, the assessment, justification, and testing were used to develop a full ECL in the Qinghai province ecoregion of China, as Table 3. The 500 Plateau Domain was an empty entry between the US and China's ECL framework. The lower-level study case in QingHai province of China study had performed more time saving and cost less, in which using biogeoclimatic conditions produced three levels of ECL under the one Section. This approach was based on plant ecologist sophistical experiences (Hou 1983; Harris 1973; Zhou et al. 1987; Baldwin et al. 2019; Faber-Langendoen et al. 2020) to develop the vegetation classification system with a nested structure on biogeoclimatic principles. The map products were produced from regional to local scales and represented high relations among the long-term climate condition, climax vegetation, and dominant plant species. The biogeoclimatic Ecosystem Classification (BEC) approach was a quick approach identified as an ecological framework for vegetation classification, mapping, and monitoring vegetation dynamics (McLennan et al. 2018). Notably, an edatopic grid displayed the site condition between soil nutrient regime and soil moisture regime (Mackenzie et al. 2017).
Ecologists have been studying different computational models in ecological classification such as LeNet, AlexNet, VGG models, residual neural network, and inception models (De'ath et al. 2000; Olden et al. 2008; Brodrick et al. 2019). The biggest challenge lies in the need for an extensive training dataset to achieve high accuracy. Using examples, train algorithms and the machine can only detect what criteria have been previously shown and selected. However, implementing algorithms provided valuable methods for analyzing nonlinear data with complex interactions and can be helpful for ecological studies and ecosystem classification. Moreover, they can achieve great accuracy when choosing various tools for identification and classification tasks. As a result, achieving better and unbiased ecological predictions is more feasible now. These were benefited from the availability of ecological data that has increased dramatically. Contribution for increasing data availability is extensively related to using GIS and remote sensing and sizeable international research networks (Iwao et al. 2011; Silver and Carrol 2013; Zhang et al. 2016).
With further understanding, the ecosystem classification approaches and enhancing ecological modeling experiences (West et al. 2005; Zhang et al. 2008, 2010; Zhang et al. 2016; Zhang et al. 2017; Mackenzie et al. 2017; Zhang and West 2021), and objectively defined ecosystem classification can be integrated by using a computer algorithm to develop efficient tools and affordable applications without losing hierarchical structure feature.
Likewise, our two case studies of ECLs had used the upper levels of Domain, Division, Province, and Section data and carried out a deliverable application associated with a scaled lower level ECLs such as the ecological sites and vegetation stands. The objectively defined algorism and analysis generated internal function outputs. The slope and landform models were based on objective needs, and the vegetation, soil, and geology data could be considered attribute data sources dependent on the project. Even though these two implementing study cases left many questions about the ecosystem structure on a particular scale? At what scale level, we can output ecosystem service for our fast-changing society inquiries (United Nations 1992; Mengist et al. 2019).
Ecosystem regionalization is a scale-based approach to classifying land surface, combined with regional and continental data on climate, geomorphology, landform, lithology, and characteristic flora and fauna. Also, we should have understood more on taking geology, landform, soils, vegetation, and climate into account to determine their biogeographical regions in different scales and ecosystem levels, while the boundaries of these ecoregions are still being studying and delineated in a global-wide scheme.
Availability of data and materials
US Upper level Ecoregion: https://www.environment.fhwa.dot.gov/env_topics/ecosystems/veg_mgmt_rpt/images/vegmgmt_ecoregional_approach_fig03.png. China’s Upper level Ecoregion: Map retrieved from Wu et al. (2003a,b).
References
Albert DA, Lapin M, Pearsall DR (2015) Knowing the territory: landscape ecosystem and mapping. The Michigan Botanist 54:34–41
Allen CR, Angeler DG, Garmestani AS, Gunderson LH, Holling CS (2014) Panarchy: theory and application. Ecosystems 17:578–589. https://doi.org/10.1007/s10021-013-9744-2
Bailey RG (1983) Identifying ecoregion boundaries. Environ Manage 34(1):14–26. https://doi.org/10.1007/s00267-003-0163-6
Bailey RG (1995) Description of the ecoregions of the United States, 2nd ed. Rev. and expanded (1st ed. 1980). Misc. Publ. No. 1391 (Rev). Washington DC USDA Forest Service.
Bailey RG (1996a) Ecosystem geography. Springer, New York
Bailey RG (1996b) Ecosystem geography: from ecoregions to sites. Springer, New York
Bailey RG, Hogg HC (1986) A world ecoregions map for resource reporting. Environ Convers 12:195–202. https://doi.org/10.1017/S0376892900036237
Baldwin K, Chapman K, Meidinger D et al (2019) The Canadian national vegetation classification: principles, methods and status. Natural Resources Canada, Canadian Forest Service Information Report GLC-X-23: 1–163. https://d1ied5g1xfgpx8.cloudfront.net/pdfs/39939.pdf
Belda M, Holtanova E, Halenká T, Kalvová J (2014) Climate classification revisited: from Köppen to Trewartha. Clim Res 59:1–13. https://doi.org/10.3354/cr01204
Berhane TM, Lane CR, Wu QS et al (2018) Decision-tree, rule-based, and random forest classification of high-resolution multispectral imagery for wetland mapping and inventory. Remote Sens (basel) 10(4):580. https://doi.org/10.3390/rs10040580
Brodrick P, Davies A, Asner G (2019) Uncovering ecological patterns with convolutional neural networks. Trends Ecol Evol 34:1–12. https://doi.org/10.1016/j.tree.2019.03.006
Buruso FH (2018) Habitat suitability analysis for hippopotamus (H. amphibious) using GIS and remote sensing in Lake Tana and its environs, Ethiopia. Environ Syst Res 6:6. https://doi.org/10.1186/s40068-017-0083-8
Clark JS, Carpenter SR, Barber M, Collins S, Dobson A, Foley JA et al (2001) Ecological forecasts: an emerging imperative. Science 293:657–670. https://doi.org/10.1126/science.293.5530.657
Cleland DT, Avers PE, McNab WH, Jensen ME, Bailey RG, King T, Russell WE (1997) National hierarchical framework of ecological units. In: Boyce MS, Haney A (eds) Ecosystem management applications for sustainable forest and wildlife resources. Yale University Press, New Haven, pp 181–200
Creque JA, Bassett SD, West NE (1999) Viewpoint: delineating ecological sites. J Range Manag 52:546–549
De’ath D, & Fabricius KE, (2000) Classification and regression trees: a powerful yet simple technique for ecological data analysis. Ecology 8(11):3178–3192. https://doi.org/10.1890/0012-9658(2000)081[3178:CARTAP]2.0.CO;2
Debeljak M, Džerosk S (2011) Decision trees in ecological modelling Modeling complex ecological dynamics—MCED. In: Jopp F, Reuter H, Breckling B (eds). 1st Edn, 400 p. 131 illus., Softcover ISBN: 978-3-642-05028-2. https://doi.org/10.1007/978-3-642-05029-9.
Ecological Stratification Working Group (1996) A National Ecological Framework for Canada. Agriculture and Agri-Food Canada, Research Branch, Centre for Land and Biological Resources Research and Environment Canada, State of Environment Directorate, Ottawa/Hull. 125pp. And Map at scale 1:7.5 million. https://sis.agr.gc.ca/cansis/publications/manuals/1996/A42-65-1996-national-ecological-framework.pdf. Accessed 7 Sept 2021
ECOMAP (1993) National hierarchical framework of ecological units. U.S. Department of Agriculture, Forest Service, Washington, DC. https://www.researchgate.net/publication/237419014_National_hierarchical_framework_of_ecological_units. Accessed 1 Sept 2021
Faber-Langendoen D, Navarro G, Willner W, et al (2020) Perspectives on terrestrial biomes: the international vegetation classification. In: Goldstein MI, DellaSala DA (eds). Encyclopedia of the World's Biomes, Elsevier, Pages 1–15, ISBN 9780128160978. https://doi.org/10.1016/B978-0-12-409548-9.12417-0
Fu BJ (2001) Scheme of ecological regionalization in China. Acta Ecol Sin 21(1):1–6
Gebregergs T, Teka K, Taye G et al (2021) Impacts of phased–out land restoration programs on vegetation cover change in Eastern Tigray, Ethiopia. Environ Syst Res 10:27. https://doi.org/10.1186/s40068-021-00231-7
Harris S (1973) Comments on the application of the holdridge system for classification of world life zones as applied to Costa Rica. Arctic Alpine Res 5(3):A187–A191
Hornsmann, Inga & Pesch, Roland & Schmidt, Gunther & Schröder, Winfried (2008) Calculation of an Ecological Land Classification of Europe (ELCE) and its application for optimising environmental monitoring networks. https://www.researchgate.net/publication/275039549_Calculation_of_an_Ecological_Land_Classification_of_Europe_ELCE_and_its_application_for_optimising_environmental_monitoring_networksAccessed 27 Sept 2021
Hou XY (1983) Vegetation of China with reference to its geographic distribution. Ann Missouri Bot Gard 70:509–548
Hutchinson MF, McIntyre S, Hobbs RJ, Stein JL, Garnett S, Kinloch J (2005) Integrating a global agro-climatic classification with bioregional boundaries in Australia. Glob Ecol Biogeogr 14:197–212. https://doi.org/10.1111/j.1466-822X.2005.00154.x
Iwao K, Nishida K et al (2011) Creation of new global land cover map with map integration. J Geogr Inf Syst 3:160–165. https://doi.org/10.4236/jgis.2011.32013
Khaiter PA, Erechtchoukova MG (2018) Conceptualizing an environmental software modeling framework for sustainable management using UML. J Environ Inf [S.l.]; p. 123–138. http://www.jeionline.org/index.php?journal=mys&page=article&op=view&path%5B%5D=201800400. Accessed 27 Sept 2021
MacKenzie WH, Medidinger DV (2017) The biogeoclimatic ecosystem classification approach: an ecological framework for vegetation classification. Phytocoenologia. https://doi.org/10.1127/phyto/2017/0160
Mclennan DS, Mackenzie WH, Meidinger D, Wagner J, Arko C (2018) A standardized ecosystem classification for the coordination and design of long-term terrestrial ecosystem monitoring in arctic-subarctic biomes. Arctic 71(1):1–15. https://doi.org/10.14430/arctic4621
Mengist W, Soromessa T (2019) Assessment of forest ecosystem service research trends and methodological approaches at a global level: a meta-analysis. Environ Syst Res 8:22. https://doi.org/10.1186/s40068-019-0150-4
Mueller M, Pander J, Geist J (2014) A new tool for assessment and monitoring of community and ecosystem change based on multivariate abundance data integration from different taxonomic groups. Environ Syst Res 3:12. https://doi.org/10.1186/2193-2697-3-12
Olden JD, Lawler JJ, Poff NL (2008) Machine learning methods without tears: a primer for ecologists. Q Rev Biol 83:171–193. https://doi.org/10.1086/587826
O’Neill RV, DeAngells DL, Waide JG, Allen TFH (1986) A hierarchical concept of ecosystems. Princeton University Press, Princeton
Paul SS, Li J, Wheate R, Li Y (2018) Application of object oriented image classification and markov chain modeling for land use and land cover change analysis. J Environ Inf [S.l.], 30–40. ISSN 1684-8799. https://doi.org/10.3808/jei.201700368
Rowe JS (1961) The level of integration concept and ecology. Ecology 42:420–427. https://doi.org/10.2307/1932098
Silver KC, Carroll M (2013) A comparative review of North American tundra delineations. Int J Geo-Inf 2(2):324–348. https://doi.org/10.3390/ijgi2020324
Sun XY, Zhou QX, Yu HB, Meng W (2010) Comparative study on ecoregion and its classification systems between China and USA. Acta Ecol Sin 30:3010–3017
United Nations (1992) Convention on Biological Diversity (text with annexes). United Nations Environment Programme. http://www.cbd.int/doc/legal/cbd-en.pdf. Accessed 1 Sept 2021
Wallace KJ (2007) Classification of ecosystem services: problems and solutions. Biol Cons 139:235–246. https://doi.org/10.1016/j.biocon.2007.07.015
Wang HH, Grant WE (2019a) Chapter 7—Model application. In: Wang HH, Grant WE (eds) Developments in environmental modelling. Elsevier. 31: 111–129. ISBN 9780444641632. https://doi.org/10.1016/B978-0-444-64163-2.00007-4
Wang HH, Grant WE (2019b) Chapter 13—integration of existing models. In: Wang HH, Grant WE (eds) Developments in environmental modelling. Elsevier, 31: 235–248. ISBN 9780444641632. https://doi.org/10.1016/B978-0-444-64163-2.00013-X.
Wang N, Cheng WM, Wang BX, Liu QY, Zhou CH (2020) Geomorphological regionalization theory system and division methodology of China. J Geog Sci 30(2):212–232. https://doi.org/10.1007/s11442-020-1724-9
West NE, Dougher FI, Manis GS, Ramsey RD (2005) A comprehensive ecological land classification for Utah’s West Desert. Western N Am Nat 65(3):281–309
Wiegand AN, Walker C, Duncan PF et al (2013) A systematic approach for modeling quantitative lake ecosystem data to facilitate proactive urban lake management. Environ Syst Res 2:3. https://doi.org/10.1186/2193-2697-2-3
Wu SH, Yang QY, Zheng D (2003a) Comparative study on eco-geographic regional systems between China and USA. Acta Geogr Sin 58(5):686–694
Wu SH, Yang QY, Zheng D (2003b) Delineation of eco-geographic regional systems of China. J Geogr Sci 13(3):209–315
Yates KL, Bouchet PJ, Caley MJ et al (2018) Outstanding challenges in the transferability of ecological models. Trends Ecol Evol 33:790–802. https://doi.org/10.1016/j.tree.2018.08.001
Yue TX, Fan ZM, Liu JY, Wei BX (2006) Scenarios of major terrestrial ecosystems of China. Ecol Model 199:363–376. https://doi.org/10.1016/j.ecolmodel.2006.05.026
Zhang YQ, Zhou XM (1992) The quantitative classification and ordination of Haibei alpine meadow. Acta Phytoecol ET Geobotanica Sin 16(1):36–42
Zhang YQ, Peterman M, Aun D, Zhang YM (2008) Cellular automata: simulating alpine tundra vegetation dynamics in response to global warming. Arctic Antarctic Alpine Res 40(1):256–263
Zhang YQ, Song MH, Welker J (2010) Simulating alpine tundra vegetation dynamics in response to global warming in China. In: Global warming. pp 221–250. https://www.intechopen.com/chapters/12178.
Zhang LP, Xia GS, Wu TF, Lin L, Tai XC (2016) Deep learning for remote sensing image understanding. J Sens Article ID 7954154, 2 pages. https://doi.org/10.1155/2016/7954154
Zhang LW, Lu YH, Fu BJ et al (2017) Mapping ecosystem services for China’s ecoregions with a biophysical surrogate approach. Landsc Urban Plan 161:22–31. https://doi.org/10.1016/j.landurbplan.2016.12.015
Zhang YQ, West NE (2021) Implement and Analysis on Current Ecosystem Classification in Western Utah of the United States & Yukon Territory of Canada. In: Muhammad AI (ed) Grasses and Grassland - New Perspectives
Zheng D (1999) A study on the eco-geographic regional system of China, FAO FRA2000 global ecological zoning workshop, Cambridge, UK. http://www.fao.org/3/ae344e/ae344e09.htm. Accessed 1 Sept 2021
Zhou XM, Wang ZhB, Du Q (1987) Qinghai vegetation. Qinghai People Press, Xining
Zhou Y, Fan J, Wang X (2020) Assessment of varying changes of vegetation and response to climatic factors using GIMMS NDVI3g on the Tibetan Plateau. PLoS ONE 15(6):e0234848. https://doi.org/10.1371/journal.pone.0234848
Acknowledgements
Correspondence author participated in the Western Utah ECL project with Prof. Neil West, by a funded project located at Utah State University (Refer to West et al. 2005), and the Haibei Alpine Ecosystem Study project supported by Haibei Alpine Ecosystem Research Station funding, CAS (Refer to Zhang et al. 2008). Thanks to Prof. Neil West for his past advice and Prof. Zhou for his always encouragement. Thanks to Simon Fraser University Library Open Access Funds for eligible journal support.
Funding
Final stage's research fund was supported by Instant Calling Spatial Arch lab, Burnaby, B.C. Canada. This study was supported in a partnership by National Center for Ecological Analysis and Synthesis (ICSA-funding-2322a).
Author information
Authors and Affiliations
Contributions
Author has contributed a lot to this manuscript. The author read and approved the final manuscript.
Corresponding author
Ethics declarations
Ethics approval and consent to participate
Author confirmed that there is no ethical conflict.
Consent for publication
Author has read the manuscript carefully and agreed to submit it for publication.
Competing interests
Author declares that there are no competing interests.
Additional information
Publisher's Note
Springer Nature remains neutral with regard to jurisdictional claims in published maps and institutional affiliations.
Glossary
- Macroecosystem
-
Groups of spatially related ecosystems can be considered as higher-order and commonly greater size, defined by Bailey (1983).
- Ecoregion
-
A defined area with the delineated ecological boundaries. First proposed in 1962 by the Canadian forest researcher Orie Loucks (1962). In 1967 Growley mapped the ecoregions of Canada based on macrofeatures of the climate and vegetation. Bailey mapped the ecoregions of the United States in 1976, revised in 1995 and 1996.
- Ecological sites
-
Defined as the fundamental land for evaluating rangeland condition and trend (Creque et al. 1999), and provide essential information for natural resource planning and management. Ecological site maps may be used to delineate ecosystems, assess resources, conduct environmental analyses, and manage and monitor natural resources (Cleland et al. 1997).
- Objectively defined algorism
-
Features whose values are taken from a defined set of values. For instance, Temperature in a set of climate data, aspect and slope always taken from landform.
Rights and permissions
Open Access This article is licensed under a Creative Commons Attribution 4.0 International License, which permits use, sharing, adaptation, distribution and reproduction in any medium or format, as long as you give appropriate credit to the original author(s) and the source, provide a link to the Creative Commons licence, and indicate if changes were made. The images or other third party material in this article are included in the article's Creative Commons licence, unless indicated otherwise in a credit line to the material. If material is not included in the article's Creative Commons licence and your intended use is not permitted by statutory regulation or exceeds the permitted use, you will need to obtain permission directly from the copyright holder. To view a copy of this licence, visit http://creativecommons.org/licenses/by/4.0/.
About this article

Cite this article
Zhang, Y. A hierarchical analysis of ecosystem classification with implementing in two continental ecoregions. Environ Syst Res 10, 39 (2021). https://doi.org/10.1186/s40068-021-00243-3
Received:
Accepted:
Published:
DOI: https://doi.org/10.1186/s40068-021-00243-3